New in R2018
This page describes the changes made to UniPlot R2018 since UniPlot version R2017.
New in R2018.13 (2019-12-03)
Bug Fixes
(ID4426): Data=>Data Exchange (Page): Because of an error in the record filter dialog (see Dialog Box=>Data Filter), a record filter could not be specified in the data exchange dialog box. This error occurred only in the release R2018.12.
New in R2018.12 (2019-11-29)
Enhancements
Defining Formulas: Formula location placeholders now support up to three digits (previously up to two). For example the formula
F_<ccc> = m_<ccc> * acalculates the channelF_123from the channelm_123.
Bug Fixes
- (ID4419): Overview Field Functions: When updating the field functions,
an error occurred, if the option “Show text label” was selected, but no labels were defined.
(ID4420): Import of CAN Files: BLF channels with
SIG_VALTYPE_ = 1(float) were not scaled correctly.(ID4421): Data=>Box Whisker: The box-whisker plot was not saved in the IPZ document.
New options have been added to this function: Notched box for display the 95% confidence interval of the median as well as an option to display a text object with the median value and IQR.
(ID4422): Data=>Data Exchange (Page): An error occurred during data exchange, if a page contained a 3D dataset that did not contain isoline values.
(ID4423): Diagram=>Layout=>Polar: The label of the polar diagram was not displayed correctly for some angles. For datasets in the polar diagram, the fill color could not be set or enabled. User labels were not displayed. See also Diagram=>X/Y/Z-Axis=>User Label.
Help=>Check for Updates: A problem was fixed where a new version was downloaded but the setup was not started. This happend if the user directory is on a network share.
Help=>Check for Updates: Fix the “What’s New” link pointing to the current version.
(ID4424): Dialog Box=>Data Filter: Record filter, containing OR operators were not fully added to the list of filters. In the new version, the filters can now be sorted, written to a file and read from a file.
New in R2018.11 (2019-10-18)
Enhancements
New field function @f{latex} to display LaTeX formulas:
@f{latex($$\mathsf{\dot{m}}$$)}or:
@f{latex(m_dot)}Output:

where
m_dotis the name of a latex formula defined with the command Tools=>LaTeX Formula Configuration. The field function can be used in text object, table objects, axis titles and axis labels.NC_AddFiles: New Parameter
obj.bKeepTimeGaps.(ID4416): Tools=>Dataset Style Configuration: New button
Copy style...added.
Bug Fixes
(ID4404): @f{legendchannel}: An error occurred, if 2 diagrams were specified, but less than 2 datasets existed in the diagram.
(ID4405): Data=>Threshold (Range), XYThresholdCreate: A vertical range was displayed as a diagonal line.
(ID4407): File=>Export Data: The export directory could not be selected.
(ID4411): Data=>Data Exchange (Page): The autoscaling was not updated, if a diagram contained only 3D datasets (maps).
(ID4417): Diagram=>Insert Field Function: For field functions without parameters could not be used without round brackets. Example:
@f{3dlegend}.
New in R2018.10 (2019-09-13)
Bug Fixes
(ID4396): UniScript as an COM-Server: Calling the function auto_ImportData failed, if the function was called via the UniScript COM server. The following example can be executed in the UniPlot command window:
* o = GetObject("uniscript32")
* ssDir = o.call("GetRootDirectory")
* o.call("auto_ImportData", ssDir + "samples/test1.xls")
T:\my_data\test1.xls.nc2
(ID4399): plotcategory: The X-axis labels were not updated during the data exchange for a category plot. In order for the update to work, the dataset must be reloaded.
(ID4401): DialogBox: If the dialog box contains a static text box with a callback function, the length of the callback function was added to the field length of the control. Example:
"|Sf @_test_Callback_sf|"(ID4402): Data=>Data Cursor: If the dataset contained filter data with a different x-range than the original data, the cursor was not displayed. Example: The problem occurred, if the
extractfunction was used as a filter function.
New in R2018.9 (2019-07-12)
Enhancements
@f{excel_data}: New field function to convert parts of an Excel spreadsheet into an UniPlot table. The table is linked to the Excel file name and is updated when the field functions are updated. With F9 the update can be executed at any time.
The field function can be inserted into a page with the command Diagram=>More Functions=>Diagramm=>Create Table Linked to Excel Sheet. Double-click on the the link can be edited.
Bug Fixes
(ID4360): Data=>Data Exchange (Page): During the data exchange the placeholders in a table object were not updated, if the table was located in a grouped element.
(ID4385): File=>Send to PowerPoint and PageSendToPowerPoint: If a text contained underscores, the underscores in EMF format have been slitely shifted to the left.
(ID4387): File=>Send to PowerPoint and PageSendToPowerPoint: The bounding box of the EMF+ file was calculated incorrectly, if the page contained 2D datasets with color filling and the dataset was only partly displayed in the diagram. If the UniPlot document contained pages with different orientation (portrait/landscape), the pages were not displayed with the correct height/width ratio. This error occurred with all supported meta file formats (WMF, EMF, EMF+).
(ID4388): Excel-Import: If the size of the uncompressed Excel sheet was greater than 2.14 GByte, UniPlot crashed while reading the Excel sheet.
(ID4389): Dialog Box=>Errorbars: The error bars were not displayed correctly, if the axis was log scaled. The load attribute X-Sort was not evaluated correctly.
(ID4390): Page=>Select Master Page: When selecting the Background page that the pages were not marked as modified. Therefor the selected background name was not saved.
Fix a problem where opening a file from an UNC path containing a double backslashes (ex:
\\server\share\foo\\bar.ipz) leads to a triggered assertion.
New in R2018.8 (2019-05-31)
Bug Fixes
(ID4373): Import of MDF4 Files: Scaling type 7 was not supported. If the scaling type was used in the MDF4 file, the data was previously unscaled.
(ID4375): PageSetTitle: If the page name contained exactly 128 characters, UniPlot caused a memory access violation and was terminated without that opened documents have been saved.
(ID4377): ExcelWriteEx: The length of a cell text for XLSX files was limited to 255 characters. The function now supports the maximum permissible text length of 32767 characters per cell.
(ID4380): Import of MDF Files: Performance improvement for MDF files with a huge number of channels and time groups. (Example: 11,000 Channels in 1400 time groups: Before 162s. With improvement 16s.)
(ID4381): 3D-Classification of a XY-Dataset: The dataset were not updated during data exchange.
(ID4382): auto_GetData: Missing Values were not removed from the result vector, if only one channel was requested and the parameter bRemoveMissingValues was set to TRUE.
(ID4383): File=>Send to PowerPoint and PageSendToPowerPoint: If the page contained underlined text, the export result contained unwanted, small gaps in the underline.
New in R2018.7 (2019-04-19)
Bug Fixes
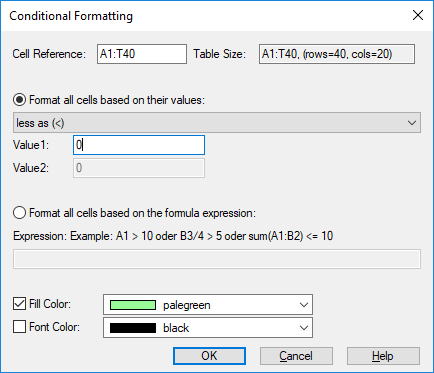
(ID4362): Edit=>Conditional Formatting: The dialog box cound not be used to edit the conditions.
(ID4366): Edit=>Copy Page: The command did not copy the page as an OLE object to the clipboard. Only a blanck page was displayed in the destination document, for example PowerPoint. The page is inserted as a WMF (Windows Meta File) into the clipboard.
(ID4367): File=>Metafile/Bitmap-Export: The EMF+ export did not calculate the bounding box correctly.
(ID4368): Diagram=>Layout=>Polar: The diagram grid was not displayed.
(ID4369): Edit=>Conditional Formatting: If the format sets the font color, the font size and other font properties could not be set.
New in R2018.6 (2019-03-15)
Enhancements
Edit=>Conditional Formatting: Conditional formatting can be specified for a table object.
Import of MDF4 Files: The delayed loading has been added for MDF4 files. If the “Delayed Channel Import” is enabled (default), the channel data will be loaded when the data is accessed for the first time. This improves the import significantly. See also Tools=>More Options.
Data Tooltip: If the data files contains a enumerate attribute, the values will be displayed in the data tooltip in the field Enum Value. See also nc_get_enum_values. Enumerate values are found in MDF and MF4 data files.
File=>Metafile/Bitmap-Export: Background color and transparency can be set for PNG and TIF export.
Bug Fixes
(ID4351): NC_AddFiles: Die function failed if it was used with an MDF file and the file contained text channels. The error message was “dimredim failed”.
(ID4357): Excel 2007 Export: If a channel in the NC files does not contain a format description (channel attribute
C_format), the number format will be taken from the NC-Data Editor dialog, see Browser=>Options.(ID4358): Text Placeholder: If a textobject contained more than one placeholder the replacement did not replace all placeholder.
(ID4359): Update PowerPoint document: The function failed to execute.
New in R2018.5 (2019-02-15)
Bug Fixes
(ID4327): AppSetStatusBarText: A memory access violation occurred, if the message text was longer than 1024 characters and the progress dialog box was displayed. See AppProgressDialog.
(ID4328): call: The call
call("sin", 1)caused a memory access violation(C00000005), if the ref:sin function was invoked.(ID4329): profiler_start, profiler_stop: Function invoked by the call function were counted and the execution time was measured twice.
(ID4330): Table Calculation: Some real values were interpreted as date/time values. The calculation failed for these values. For example the value 8.23 was recognized as a date value (
DT_ParseDateTime("8.23")).(ID4333): NC_AddFiles: If channels from different time groups were added to one time group in the destination data file, an error occurred. Now the data is interpolated to the new time axis.
(ID4335): The try-except Statement-The try-except Statement-Statement: If a The try-except Statement block was used inside a The for Statement loop and a The break and continue Statement statement was used to terminate the iteration, the execution did not end the The for Statement loop. Instead the The try-except Statement statement was executed.
(ID4336): File=>Send to PowerPoint and PageSendToPowerPoint: If the IPZ/IPW filename plus the page name was longer than 240 characters, an error occurred (shape Name is limited to 254 characters in PowerPoint). The file and page name is used to update the shape object in PowerPoint, if the IPZ/IPW file is modified.
(ID4338): PageSaveAsBitmap: The function had a memory leak. A call of the :ref:ImageDestroy` function was missing.
(ID4345): Edit=>Copy Format: The axis color and axis title font for diagrams (layers) was not copied.
(ID4346): File=>Send to PowerPoint: If datasets displayed markers and the PowerPoint document was saved as a PDF document, it could not be displayed with the Acrobat Reader. The Acrobat Reader displayed an error message.
(ID4348): XYSetBarFillColor: The function did not set the color successfully. Therefore all bars in the category plot were displayed in red, the default color.
New in R2018.4 (2019-01-18)
Bug Fixes
(ID4301): XYSetProps: The marker transparency for the fill color could not be set in the dataset style. The transparency can be set with the new parameter
marker-fill-alpha.(ID4314): Table Calculation: Functions with a range as a parameter caused an error. Example:
=mean(A1:A3).(ID4315): nc_varput_text: The function would fail, if a text element was longer than the dimension for the specified channel. (The second dimension sets the maximum number of characters for a text channel.)
(ID4316): Diagram=>X/Y/Z-Axis=>User Label. The label font could only be set using the font toolbar. Now, a button has been added to the dialog box to set the label font.
(ID4317): A double click on a data file with the extension
.ncor.nc2in the Windows Explorer did not open the data file, if UniPlot was not already running.(ID4319): @f{3dlegend}: The option
@f{3dlegend(ZAxisTitle)}showed an unexpected line symbol. To field function@f{3dlegend(Linesymbol.ZAxisTitle)}shows the line symbol with the axis title. See Diagram=>Insert Field Function on how to create a legend for 3D datasets.(ID4323): Import of MDF Files: If a channel had an offset of more than 8192 bytes, it was not imported correctly. For example only the first 1024 channels in one group with the data type double could be imported correctly. If the data type was identical to the channel with an offset of 0 bytes (time channel), it would display the data of this channel.
New in R2018.3 (2018-11-30)
Bug Fixes
(ID4194): Open an IPW/IPZ in Windows Explorer: If UniPlot was not already running, it would start but not open the document. It would only open the document, if UniPlot was already running.
(ID4295): Image embedded in text: An image in a table cell was not displayed correctly, if the scaling option was not specified. The image was cropped at the top edge.
(ID4301): MarkerSetFillColor: The transparency of markers could not be set.
(ID4303): nc_to_obj: Channels with symbols in the name, for example a period, were missing in the result object.
(ID4306): Data=>3D Color Legend: If the number of elements was changed (number of iso line values) the font of added elements was modified.
(ID4309): In some cases, UniPlot would be closed without saving any modified documents, if an editor window was closed.
(ID4310): Edit Object=>Table: Pasting data from clipboard failed, if the clipboard contained data from more than one table cell.
(ID4311): Edit=>Object Properties=>Picture: The dialog box could not be displayed. Instead of the dialog box an error message was displayed, if an image was double clicked.
(ID4312): auto_xyz_RelDiv: If a relative difference map was created and the divisor was 0, a message box stated that all 0 values will be set to 0.01. Now, instead of a message box, a log warning will be added to the event window.
New in R2018.2 (2018-10-26)
Enhancements
Data=>Threshold (Range): The threshold can be specified as a range. The range is displayed as a bar in the diagram.
sqlite3: Update to version 3.25.2 (2018-09-25).
Data=>Data Exchange (Page): If necessary, the distinction of the data sources by record filters can be switched off. The option is useful, if several record filters have been defined, but the data exchange does not have to be edited.
New and changed UniScript functions, see UniScript R2018.
Bug Fixes
(ID4278): Edit Object=>Table Configuration: The position reference (eg left-top) was not applied.
(ID4284): Import of IFILE Data Files: The real-time results (RTP) were not correctly written to the NC file or were missing in the NC file.
(ID4286): Import of MDF4 Files: Importing MDF4 files with very large data blocks (> 2 GB) could fail. Now large blocks are broken up into smaller blocks.
(ID4287): File=>Send to PowerPoint: Until UniPlot R2018.1 pages were sent to PowerPoint as EMFDual files. The format was causing problems with the page size. In some cases the pages were displayed too small. The problem occurred, if only a section of the data had been displayed in the diagram. The pages are now transferred as an EMF file to avoid the error.
(ID4290): ncdump.exe: The ncdump.exe did not start to dump the specified NC2 file.
(ID4292): DialogBox: If the dialog contained a report control with a static text box with a button, the button covered the complete field when activating.
(ID4293): File=>PDF-Export: If a page contained a diagram or drawing object with a color gradient, the top color was displayed at the bottom as a bar.
New in R2018.1 (2018-08-24)
Enhancements
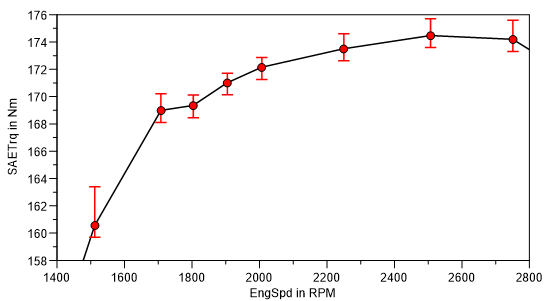
Error bars: The data for error bars can now be loaded from channels. To do this, choose “2D: x/y Errorbars” in the Data Browser. A channel for the positive error and a channel for the negative error must be selected.
Bug Fixes
(ID4262): ASAM-ODS Browser (CORBA): The password for the ASAM ODS server had to be reentered over and over again by some users. To correct the error, the password is saved using a new method: It is necessary to re-enter the password for the first access. The password will be stored encrypted.
(ID4264): The diagram grid was not displayed when a dotted or dashed line type was selected. The grid lines were missing in the export result as well.
(ID4265): Edit=>Copy Page: PowerPoint/Word Export: Sometimes datasets were missing, if a document page was copied to the clipboard with
Copy pageand inserted into Word, PowerPoint or other client programs.(ID4266): If a UniPlot page was inserted into Word or PowerPoint as a WMF, EMF, EMF+ or EMFDual image, the element was missing, if the document was saved as a PDF document. The error did not occur, if the PDF file was created via a printer driver.
(ID4268): ASAM-ODS Browser (CORBA): The ODS session was not closed.
(ID4271): In a rare case, pages of a UniPlot document could not be displayed, if Direct2d was used for the screen output. UniPlot would crash, if the page was activated. The graphic library can be selected the in the Tools=>More Options dialog box in the
Installationpage.(ID4272): DialogBox: If a report element contained an edit field such as in the data exchange dialog box, the left and right error key could not be used to move the cursor in the text. The control would lose the input focus.
(ID4273): Edit Object=>Table Configuration: Numbers in table cells can now also be displayed in e-format or in hexadecimal format.
(ID4276): DocCopyPage did not copy WMF images correctly. The image was missinge in the destination document. In some cases the image in the source document was removed as well. This bug occurred in the File=>Merge Documents command.
New in R2018.0 (2018-06-28)
Enhancements
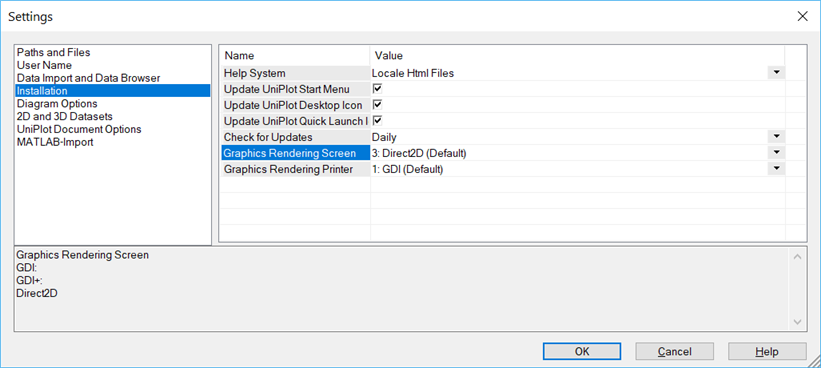
UniPlot R2017 uses GDI+ instead of GDI (Graphics Device Interface) in R2016 and before. GDI+ supports transparency and anti-aliasing. Unfortunately, the output speed for GDI+ in R2017 was not satisfactory, so in R2018 the Direct2D interface (with hardware acceleration) has been added. Direct2D archieves a very good presentation quality at high speed.
In R2018, the graphic interface can be switched between GDI, GDI + and Direct2D at runtime, see AppSetGDI and AppGetGDI.
The interface can also be selected with the command Tools=>More Options (Page Installation).
UniPlot now uses Windows Imaging Component (WIC) to display bitmaps.
Windows metafiles (vector graphics wmf, emf, emf +, emf + dual) can be generated using GDI or GDI+.
Edit=>Copy Page: OLE (Object Linking and Embedding) was removed in R2017. It is enabled again in R2018. This means that document pages in PowerPoint can be modified by a double click on the element, if the page was created using the Edit=>Copy Page command. OLE does not support transparency. Attached images are also not supported with OLE (see Edit=>Attachments).
The command File=>Metafile/Bitmap-Export has been extended (more and higher resolutions and EMF, EMF+ (Enhanced Metafile Format Plus Extensions), EMF+Dual).
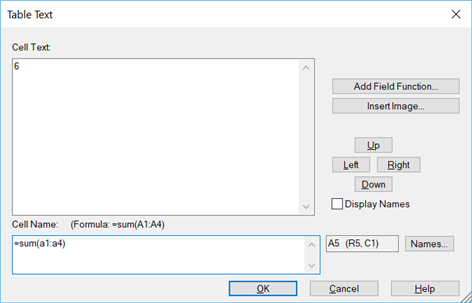
Simple formulas can be embedded into UniPlot table objects, see Edit Object=>Table. A formula begins with an equal sign and must be inserted into the name field of a table object. Example:
=sum(A1:A10)calculates the sum of the first column of row 1 to 10.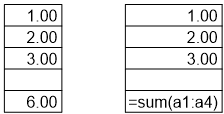
Simple formula in the cell name field:
Data=>2D Bit Dataset: New dataset type to display bit values. Example:
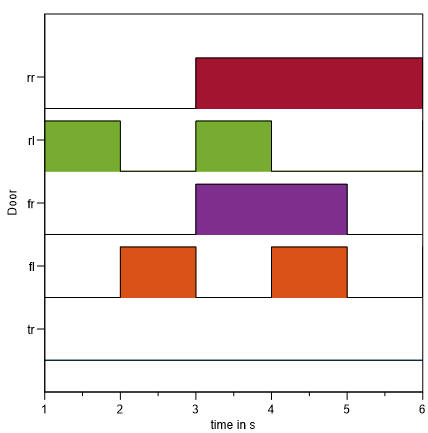
New and modified UniScript functions, see UniScript R2018.
Bug Fixes
(ID4176): The PDF export was relatively slow in R2017. Instead of GDI+, UniPlot R2018 is using GDI again to create the PDF file as in UniPlot R2016.
(ID4249): Import/Export of TDM Files: The TDM export failed, if an attribute in the NC file contained more than one element. For example, the NC attribute
XStart_XDeltacontains two Numerical values.(ID4256): Import of IFILE Data Files: An error occurred, if an IFiles contained with the data type long or float and the data was saved with variable crank angle division.
(ID4257): Data=>Threshold (Range): The option Show threshold line in legend was not evaluated correctly.
(ID4258): Import of CAN Files: If GIN data had contained time gaps greater, than approx. 70 minutes, the gaps were not correctly added to the time channel.
(ID4259): ExcelReadEx: If called with two return parameters, numerical values were only saved with 6 significant digits. Now the values are saved with 16 significant digits in the text matrix.
id-796474