XYSetProps
XYSetProps sets the dataset properties of a 2D dataset.
- bool = XYSetProps(hData, ssProps)
Return Value
If the function succeeds, the return value bool is TRUE (1); otherwise it is FALSE (0).
Parameters
- ssProps
ssProps is a scalar string with
NAME='VALUE'-pairs. Each pair sets one property. The property pairs are separated by a blank, a newline or a tab character.
Example
XYSetProps(hData, "marker='1' marker-style='circle'");
Comment
The following table contains all properties of a 2D dataset. The column Type contains the valid value range. A property can have one of the following data types: bool, int, double, color, curve_style, marker_style.
bool is the value ‘0’ or ‘1’. ‘0’ means the off, false and’1’ means on or true.
int is an in integer number (‘1’, ‘-1’, ‘144’).
double is a real number like ‘1.23’, ‘5000’, ‘1e3’.
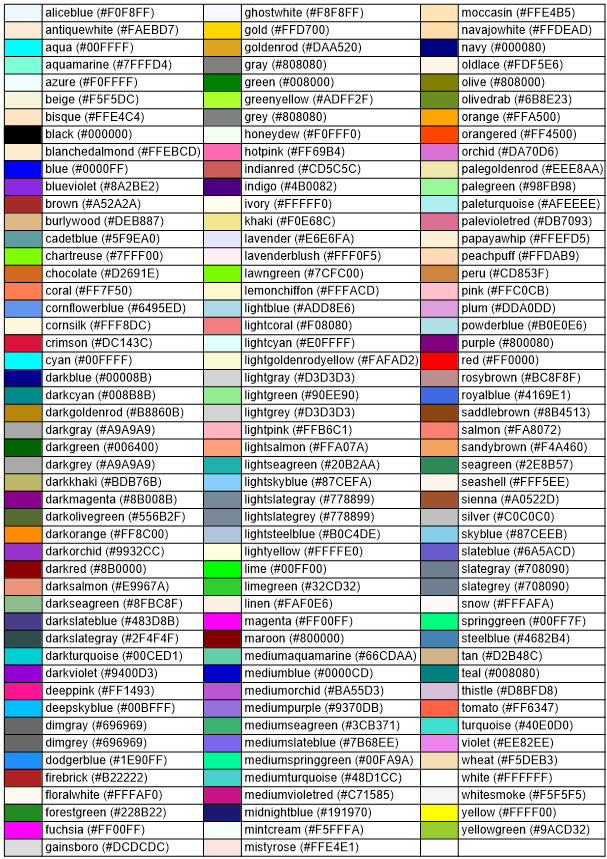
color is a name like ‘mediumblue’ (see color table), or a value like ‘#0000CD’ or an expression of the form ‘rgb(0,0,205)’. The follwing form sets the transparency ‘argb(127,0,0,205)’.
curve_style can be ‘solid’ (or ‘0’), ‘dash’, ‘dot’, ‘dashdot’, ‘dashdotdot’ ( or ‘4’).
marker_style can be one of the following values:
‘plus’ |
‘cross’ |
‘simplestar’ |
‘circle’ |
‘rectangle’ |
‘diamond’ |
‘triangle’ |
‘triangle1’ |
‘triangle2’ |
‘triangle3’ |
‘hourglass’ |
‘hourglass’ |
‘star’ |
‘circledot’ |
‘circleplus’ |
‘circlecross’ |
‘rectdot’ |
‘rectplus’ |
‘rectcross’ |
‘null’ |
‘dot’ |
or the int value ‘0’ to ‘20’.
Setting |
Type |
Default-Value |
Comment |
|---|---|---|---|
bar |
bool |
|
|
bar-base-pos |
int |
|
‘0’: Bar origin is the minimum axis value, ‘1’ The origin is set to the drop value (see XYSetDropValue). |
bar-fill-color |
color |
|
|
bar-fill-alpha |
int |
|
|
bar-hatch-color |
color |
|
|
bar-hatch-distance |
double |
|
Distance between the hatch lines in centimeters. |
bar-hatch-offset |
double |
|
|
bar-hatch-style |
int |
|
|
bar-hatch-width |
int |
|
|
bar-pen-color |
color |
|
|
bar-pen-type |
curve_style |
|
|
bar-pen-width |
int |
|
|
bar-pos |
double |
|
|
bar-type |
int |
|
|
bar-width |
double |
|
|
bar-width-type |
int |
|
0 = width in centimers, 1 = width in percent of the diagram width. |
bar-fill-type |
int |
|
|
curve |
bool |
|
|
curve-color |
color |
|
|
curve-style |
curve_style |
|
|
curve-width |
int |
|
|
data-scale-x-factor |
double |
|
|
data-scale-x-offset |
double |
|
|
data-scale-y-factor |
double |
|
|
data-scale-y-offset |
double |
|
|
drop-pen |
bool |
|
|
drop-pen-color |
color |
|
|
drop-pen-style |
int |
|
|
drop-pen-width |
int |
|
|
err-bar |
bool |
|
|
err-bar-x-attrib |
int |
|
|
err-bar-x-cap-pen-width |
int |
|
|
err-bar-x-cap-width |
double |
|
|
err-bar-x-pen-color |
color |
|
|
err-bar-x-pen-style |
curve_style |
|
|
err-bar-x-pen-width |
int |
|
|
err-bar-x-value |
double |
|
|
err-bar-y-attrib |
int |
|
|
err-bar-y-cap-pen-width |
int |
|
|
err-bar-y-cap-width |
double |
|
|
err-bar-y-pen-color |
color |
|
|
err-bar-y-pen-style |
curve_style |
|
|
err-bar-y-pen-width |
int |
|
|
err-bar-y-value |
double |
|
|
fill |
bool |
|
|
fill-color |
color |
|
|
fill-alpha |
int |
|
|
filter-functions |
string |
|
|
filter-functions-on |
int |
|
Set to |
hatch-color |
color |
|
|
hatch-distance |
double |
|
|
hatch-offset |
double |
|
|
hatch-style |
int |
|
|
hatch-width |
double |
|
|
info-text |
string |
|
|
legend-text |
string |
|
|
marker |
int |
|
|
marker-edge-color |
color |
|
|
marker-edge-width |
int |
|
|
marker-fill-color |
color |
|
|
marker-fill-alpha |
int |
|
|
marker-frequency |
int |
|
|
marker-original |
bool |
|
|
marker-size |
double |
|
|
marker-style |
marker_style |
|
|
marker-transparent |
bool |
|
|
name |
string |
|
|
x-delta |
double |
|
|
x-start |
double |
|
|
y-base |
double |
|
Notes:
bar-type set the bar alignment.
‘0’ |
horizontal |
‘1’ |
vertical |
bar-fill-type sets the bar filling.
‘0’ |
No filling |
‘1’ |
Color filling |
‘2’ |
Hatch filling |
‘3’ |
Color and hatch filling |
filter-functions sets the filter functions. Different filter functions are available: smooth data, calculate a spline, fit data etc. For a list of filter functions see Filter Functions for XY datasets.
Example
XYSetProps(hData, "filter-functions-on='1' filter-functions='sort(); akimaspline()'");
Color Table
See also
id-428776