Data=>Threshold (Range)
This command can modify a threshold datset. Double click on a threshold dataset to open this dialog. To create a theshold dataset right click in a diagram and choose the Threshold command.
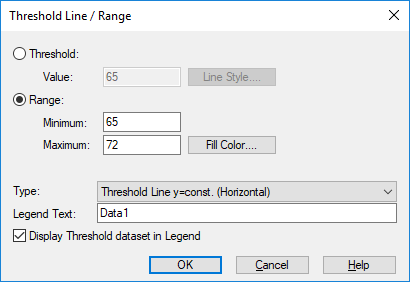
Threshold
Is the threshold value. The value will be displayed as a line.
** Range**
Defines a a threshold range. It will be displayed as a horizontal or vertical bar. The fill color can be selected.
Type
Is one of the following options:
Value
Description
Threshold Line y=const. (Horizontal)
Horizontal line
Threshold Line x=const. (Vertical)
Vertical line
Legend Text
Is the legend text.
Display threshold dataset in legend
If enabled, the legend text will be displayed in the legend.
History
Version |
Description |
|---|---|
R2018.2 |
Threshold range added. |
See also
Data, XYThresholdCreate, auto_xy_Peaks, LayerAddDataset, LayerMoveDataset
id-2100470