Data=>Box Whisker
This command creates a box whisker plot for the selected a 2D dataset.
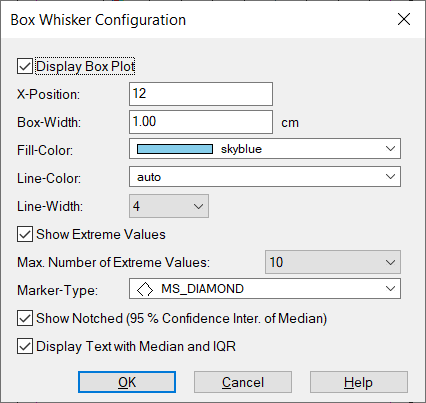
Display box plot
If checked the box whisker plot will be displayed. Othewise it will be removed.
X-position
Defines the horizontal position of the box in the diagram. The value is displayed in the Coordinates of the x-axis fixed.
Box-Width
Sets the box width in centimeters.
Fill Color
Sets the fill color. If the value is
auto, the curve line color is used as the fill color.
Line Color
Specifies the border color. The value
autodarkens the fill color or brightens the fill color.
…us.dlgitem
Line Width
Defines the width of the edge line in 0.1 mm steps.
Display Outliers
If this option is selected, the points that are outside of the 1,5 times the interquartile distance (1,5×IQR), are displayed as outliers.
The maximum length of the whiskers is limited to 1.5 times the IQR.
Max. Number of Outliers
If the number of outliers exceeds the maximum value, the outliers are sorted in ascending order and the maximum number is evenly selected.
Marker type
The marker for the outliers can be selected here.
Show Notches (95% confidence interval of the median)
The height of the notch is calculated from the IQR: Notch height: median +/- 1.57 x IQR/sqrt(n), where n is the number of data points. The depth was arbitrarily set to 20% of the box width.
Display text with median and IQR value
Creates a text object with the median value and the IQR (interquartile spacing). (English interquartile range).
Example
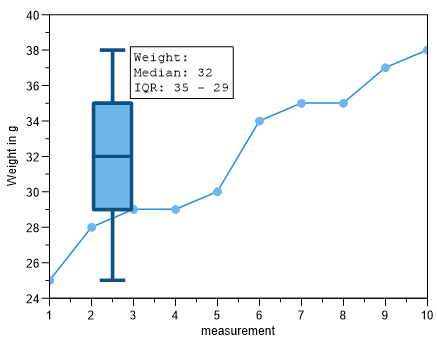
UniScript Example:
a = [25, 28, 29, 29, 30, 34, 35, 35, 37, 38];
hv = plot(1:len(a), a);
rvFillColor = [135, 206, 235];
obj = [. "BoxPlot-Show-Notched" = 1,
   "BoxPlot-Show-Info-Text" = 1,
   "BoxPlot-FillColor-Auto" = 0,
   "BoxPlot-FillColor" = rvFillColor,
   "BoxPlot-Width" = 1.0, //cm;
   "BoxPlot-XPos" = 2.5,
   "BoxPlot-LineColor-Auto" = 1,
   "BoxPlot-LineColor" = color_get_contrast_color(rvFillColor, 100),
   "BoxPlot-LineWidht" = 8,
   "BoxPlot-bShowExtreme" = TRUE,
   "BoxPlot-bShowExtreme-count" = 10,
   "BoxPlot-Marker-Style" = 5,
   "BoxPlot-Show-Notched" = FALSE,
   "BoxPlot-Show-Info-Text" = TRUE];
auto_xy_BoxPlot(hv[3], obj);
Comment
The box shows the interquartile range (IQR) and the 50% quantile (median) as a line in the box. The whisker below the box indicates the minimum of the data set and the upper whisker the maximum of the data. The maximum length of the whiskers is limited to 1.5 times the IQR. The IQR (height of the box) shows the range in which 50% of the data will fall. Interquartile range:
IQR = q0.75 - q0.25
More about the Box-Whisker-Plot can be found in the Wikipedia article Box-Plot.
See also
id-1272203