New in R2014
This page describes the changes made to UniPlot R2014 since UniPlot version R2013.
New in R2014.6 (21 Nov 2014)
Bug Fixes
(ID3842): Excel-XLSX-Import: If an Excel XLSX file did not contain any cell formats the data import failed. This error was only in UniPlot R2014.4 and R2014.5
(ID3843): Record-Filter and auto_SetFilter: To set a record filter for more than one text channel failed, if the filter text contained spaces. Example:
auto_SetFilter("$a$ == \"a a\" && $b$ == \"a c\"", "d:/test.nc2")
(ID3844): Formula Interpreter 1 - Introduction: Sometimes a selected channel name was added twice to a formula. This bug has been fixed. In the new version the channel name and operators are inserted into the formula text at the cursor position.
(ID3845): Data=>3D-Dataset=>Z-Values: The color gradient dialog box was not correctly initialized. This bug only occurred in version R2014.4 and R2014.5.
(ID3847): Diagram=>Category Options: The dialog box did not display hidden datasets.
(ID3848): The Data Browser Window: If a channel was selected using the arrow keys, the preview window displayed the previous selected channel.
New in R2014.5 (10 Nov 2014)
Bug Fixes
(ID3835): In UniPlot R2012 to R2014.4, a network error could result in corrupted IPZ files. In this case the file sometimes had 0 bytes or empty pages. The bug has been fixed.
New in R2014.4 (07 Nov 2014)
Enhancements
UniPlot Viewer: The UniPlot Viewer (http://www.uniplot.com/viewer.html) can copy pages as Metafiles (WMF) into the clipboard.
Import of Excel XLSX files: Date/Time channels are now recognized.
New/modified UniScript functions, see UniScript R2014.
Bug Fixes
(ID3798): XY-Dataset: The data tooltip (mouse on data point) was not displayed, if a dataset filter function was used and the option Symbols for Original data was selected but the option Display Symbols was not checked. See Data=>1D and 2D Dataset.
(ID3802): MDF-Dateien (INCA): If an MDF file with a huge number of text elements was imported, a memory access violation could occur. This bug has been fixed.
(ID3805): If an empty string was passed to the obj_keys function a memory access violation occurred:
o = [. ab = 1, abc = 1, aa = 1]
o.keys("ab", "")
(ID3807): File=>File Quick View: A script error occurred during the update of the place holder text elements.
(ID3808): Diagram=>X/Y/Z-Axis=>Parameters: All parameters in the dialog box where checked, if the Autoscaling option was enabled. For log scale, this could produce an error message.
(ID3812): Edit Object=>Placeholder-Dialog: If a document page contained an identical placeholder, e. g. $Title$, only one element was set. This error occurred only in R2014.3.
(ID2816): Unit Converter: The Excel file with the unit definitions could contain a unit that was specified more than one time. Now, an error message is generated.
(ID3817): Unit Converter: The units.xls file contained incorrect SI factors for the units
mmtomandmm²tom²(see also Unit Converter).(ID3819): Diagram=>Link Axes Scales: An error occurred, if x-axes with the type crank angle 720° or crank angle 360° were linked. The dialog box was not displayed.
(ID3820): Dialog Box=>Data Filter: An error occurred, if the filter value for a text channel contained spaces, for example:
Status == "Error in *".
(ID3821): The excel_sheet_open function returned 0, if the sheet was empty. Now, the function returns a valid sheet object. excel_sheet_get_rows returns 0 for an empty sheet.
(ID3828): Formula Interpreter 2 - Creating a formula table: If a formula in the formula list (Excel file) contains the formula result name in formula, an error message is created and the formula is not created. In older versions the formula was created but not evaluated. Checking the formula list failed and caused a memory access violation.
(ID3831): Using p7z_zip to create huge files could fail with a timeout after 30 seconds, if p7z_zip did not write any output into the UniScript command window.
(ID3832): excel_sheet_get_row_style returned an invalid value, if a cell in the Excel sheed did not have a style index.
(ID3834): NC_AddFiles: If a time group in the first MDF file contained only one data point, the functions failed. The bug has been fixed.
New in R2014.3 (22 Sep 2014)
Enhancements
Data=>Data Cursor: The data cursor can now also be moved with the arrow keys. While holding down the Ctrl key cursor 1 is moved otherwise the second cursor. Cursor 1 can be anchored at one position. The position will not be updated automatically if the cursor runs out of the x-axis range.
UniScript objects can now be saved in a binary format (see obj_save, obj_load).
Data=>1D and 2D Dataset: The markers can be distributed over the visible dataset range. For example 20 markers can be distributed of the curve.
New/modified UniScript functions, see UniScript R2014.
Fixed bugs, see Bug Fixes R2014.
New in R2014.2 (13 Aug 2014)
Fixed bugs, see Bug Fixes R2014.
New/modified UniScript functions, see UniScript R2014.
New in R2014.1 (09 Jul 2014)
Fixed bugs, see Bug Fixes R2014.
New in R2014.0 (04 Jul 2014)
Enhancements
Data Browser Tree View
The channels can be displayed in a tree structure.
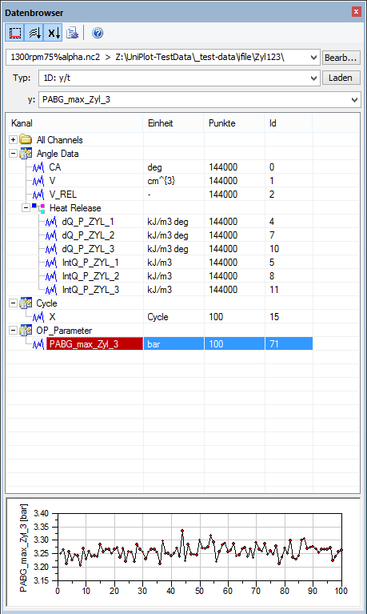
The tree view can be enabled and disabled via the tool bar in the data browser. The first element All Channels displays all available channels in the NC file.
The following file formats make use of the tree view:
CAN BLF Files: The frame names specified in the DBC file are used as group names.
MDF Files (INCA): The group comment is used as a group name. If the comment is empty or not available the group name is G1, G2, etc.
To display the channels in a tree structure the NC file must have a global
attribute _nc_hasgroups set to the value 1 (enabled) or 0 (disabled). Each
channel can have an attribute _nc_group with the name of the group element.
In the image above the dQ_P_ZYL_1 has the attribute _nc_group with the
value "Angle Data/Heat Release". See also Channel Attributes.
Command enable or disable the display of the tree structure in the data browser:
b = GetProfileInt("settings", "nc_use_groups", "", 1);
To control the display of the tree structure in a program temporarily:
_g().nc_use_groups = 1
_g().nc_use_groups = 0
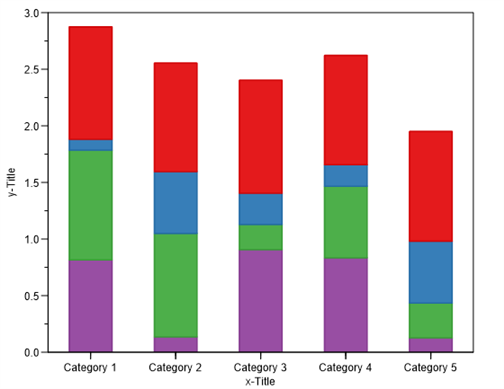
Categorie Plot, Grouped and Stacked Bars
In a category plot bars can be displayed in groups or stacked. Each category can have a description text on the x axis.
To create a category plot choose
Type = "Category Plot"in the data browser.For the “Label” field choose a channel to label the x axis.
Drag all channels into a diagram or onto a document page.
Example 1:
Example 2:
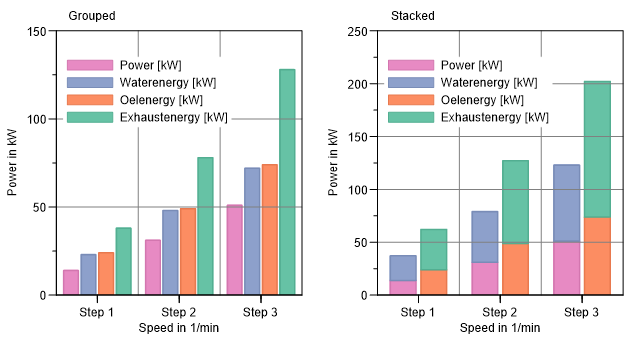
A double click on one of the datasets opens the category configuration dialog box.

Plot with user defined axes labels
Axes labels for an arbitrary position can be specified. A label on the axis has a value that defines the position and a display text. The user labels can be used to define special values on the axis. Example: The values On and Off can be displayed instead of the values 1 and 0.
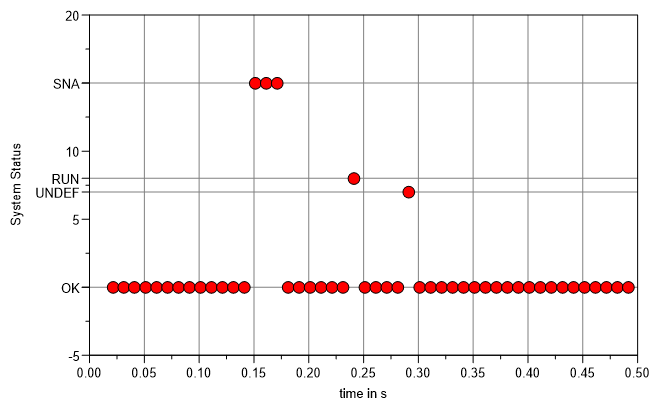
If a channel in the NC file contains the attribute _nc_enum, the values
will be loaded with the dataset as axis labels for the y-axis. The option
Enable Autoload User Label for the diagram must be enabled.
Example: _nc_enum = 15|SNA|8|RUN|7|UNDEF|0|OK
The following dialog box can be used to edit the labels:
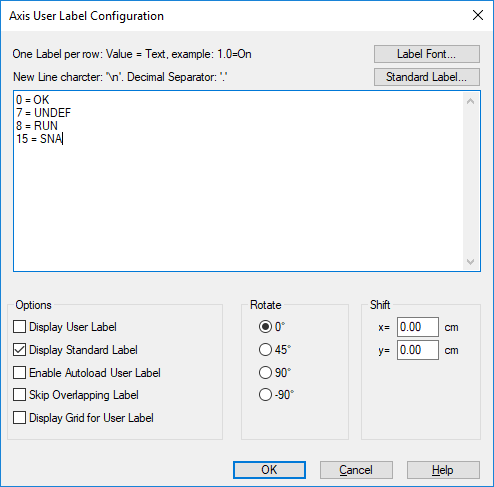
See also Diagram=>X/Y/Z-Axis=>User Label.
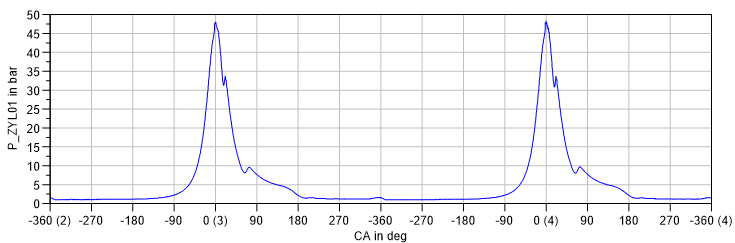
Plotting cyclic data
For indication data the x-axis can be scaled as a cycle axis. If the cycle length is 720 degree, the axis will be scaled from -360 to 360 degree. The cycle number will be displayed in parenttheses behind the axis label.
More Enhancements
Hexadecimal format for axes labels. See Diagram=>X/Y/Z-Axis=>Parameters.
Legend text for 1D and 2D datasets can be protected: See Data=>1D and 2D Dataset.
New function xml_simple to provide an easy to use interface to access an XML tree:
s = "[[<?xml version="1.0" encoding="UTF-8" standalone="yes"?>
<directory>
    <title>Example</title>
    <entry>
        <key>Test 1</key>
        <text>Test 1 ...</text>
    </entry>
</directory>]]"
o = xml_simple(s)
print o
[.
    directory = [.
        entry = [.
            key = "Test 1"
            text = "Test 1 ..."
        ]
        title = "Example"
    ]
]
dir = o.directory;
print dir.entry.key
print dir.title
New and modified UniScript functions, see UniScript R2014.
Bug Fixes
Fixed bugs, see Bug Fixes R2014.
If you want to stay informed about UniPlot please subscribe our RSS feed under http://www.uniplot.de/news.html. (See Wikipedia: http://de.wikipedia.org/wiki/RSS).
id-718977