Data=>3D-Dataset=>Isolines
Use this dialog box to specify plot attributes for Isolines.
- Color Filling between the Isolines
Select this check box if you want the areas between the isolines color filled. The colors can be specified in the Z-Values dialog box.
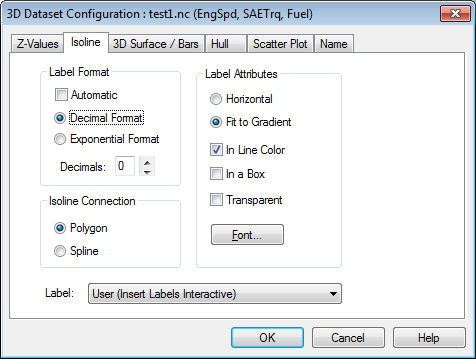
- Label Format
Set the number of decimal places for the axis values in the Decimals edit field. Use the Decimal and Exponential options to set the isoline label format.
- Isoline Connection
The isolines can be plotted as polygons or splines.
- Label Representation
Isoline labels can be plotted horizontally, or they can be plotted to follow the gradient of the isoline. The color of the label can be set to match the isoline when the In Line Color check box is selected. To frame the label, select the In a Box option.
- Transparent
If the option is checked the labels will be plotted with a white background. The labels are always plotted with a white background for the command Edit=>Copy Page and the WMF export.
- Label
Can be one of the following values:
Value
meaning
None
No Labels are Inserted
User
Insert Labels Interactive
Stripes
Three Vertical Stripes
Middle
One Label per Isoline
Random
One Label per Isoline
See also
Dialog Box=>Symbol Style, Dialog Box=>Font, Data=>3D-Dataset=>3D-Surface, Data=>3D-Dataset=>Hull
id-318582