Data=>3D-Dataset=>3D-Surface
Use this dialog box to specify the drawing attributes of the selected 3D dataset for the 3D diagram.
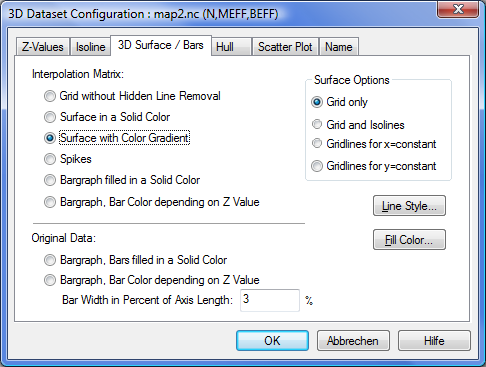
- Grid without Hidden Line Removal
The grid will be drawn as a transparent fish net without color filling.
- Surface in a Solid Color
The facets of the surface will be drawn in a solid color.
- Surface with Color Gradient
The surface will be drawn with the color gradient specified in the Z-Values dialog box.
Spikes
Bargraph filled in Solid Color
Bargraph, Bar Color depending on Z Value
Grid only
- Grid and Isolines
Isolines can only be drawn on the surface when the option Surface with Color Gradient is chosen.
Gridlines for x = constant
Gridlines for y = constant
- Line Style
Choose this button to specify the line style for the surface map grid lines. The line style will also be used to draw the isolines.
- Fill Color
Choose this button to specify the color for the Surface and Bars in a Solid Color option.
Original Data: Bargraph, Bars filled in a Solid Color
Original Data: Bargraph, Bar Color depending on Z Value
Original Data: Bar Width in Percent of Axis Length
See also
Dialog Box=>Symbol Style, Dialog Box=>Font, Data=>3D-Dataset=>Isolines, Data=>3D-Dataset=>Hull
id-483436