Data=>3D-Dataset=>Scatter Plot
Specifies the scatter plot attributes for the selected 3D dataset.
The scatter plot can only be plotted in the 2D diagram. In a scatter plot, the position of the data points on the x/y plane are plotted as symbols.
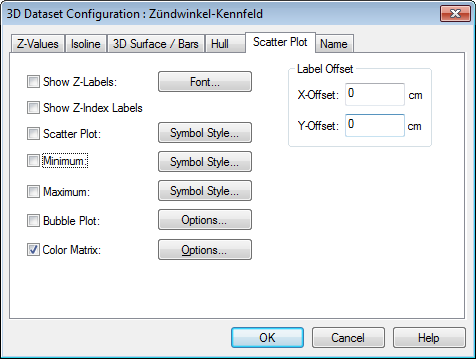
- Show Z-Labels
When checked, every data point will be labeled with its z-value.
- Show Z-Index Labels
When checked, the line number from the data file is used to label the data points.
- Scatter Plot
The data points from the contour map will be plotted as symbols when this option is chosen.
- Minimum
Click this check box if you want to mark the data point with the smallest z-value.
- Maximum
Click this check box if you want to mark the data point with the largest z-value.
- Symbol Style
Click this button to specify the symbol to mark data points.
- Font
Click this button to specify the font for the z-labels and the index labels.
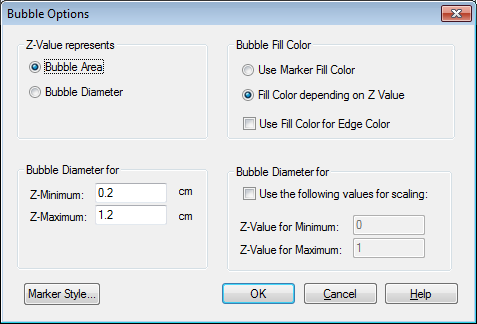
- Bubble Plot
Click the Option button to set the bubble plot options.
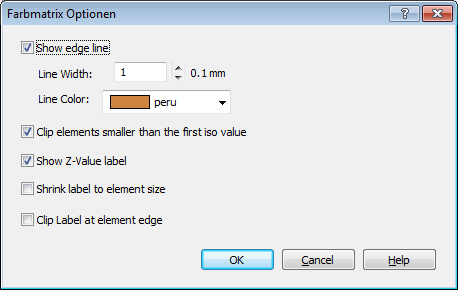
Color Matrix
See also
Dialog Box=>Symbol Style, Dialog Box=>Font, Data=>3D-Dataset=>Isolines, Data=>3D-Dataset=>3D-Surface
id-1837288