pie
pie plots a pie chart.
- hText = pie(rvX)
- hText = pie(rvX, options)
Return Value
hText is a handle of a pie chart. The pie chart uses a text object as as its drawing object.
Parameters
- rvX
rvX is a real vector with x coordinates. Only the first 32 values are used for the pie chart.
- options
options is an object with parameters to display the pie chart. The following parameters are evaluated:
Name
Type
Default
Description
color_scale
string
"Paired"Name of a color scale. See ColorScale_GetNames for a complete list.
colors
real or string
""Color for each slide. Matrix with three columns. If not specified, the parameter will be filled with the color_scale colors.
edge_color
real or string
"black"Color used to draw the edge line. If set to “auto”, the edge line will be draw in a darker slice color. Other values
[255,0,0]edge_show
real
1
If set to TRUE (1), the edge line will be drawn.
edge_width
real
1
Edge line width in 0.1 mm units.
explode
real
0
Vector with explode values in percent of the chart width. The value specifies how far a slice is pulled out of the chart.
hPage
real
0
Is a page handle. The chart will be added to the specified page. If set to 0 or if the parameter does not exists in the options parameter, a document with an empty page will be created.
labels
string
""Is a string vector with a label for each value. The default value is an empty string.
label_show
real
1
If TRUE (1), the slice label outside the pie chart are displayed.
legend_show
real
0
Display a legend table with two or three columns. It shows the color, the label text and the value (optional).
legend_values_show
real
0
Display the values in the legend.
subplot
real vector
[1,1,2,2]
subplot is a vector with 4 elements
[iRow, iCol, nRows, nCols]. The parameter is used to set the size and position of a pie chart on a page. The page will be divided in rows and columns (nRows, nCols). The first two elements selects the cell used to place the chart. Example: Use the full page:[1,1,1,1]. Use the lower half:[2,1,2,1]. Instead of the parameter subplot you can specify the x, y, width, height parameters in cm.sweep_angle
real
360
Total angle of the pie chart in the range 1° to 360°. Default value is 360°.
start_angle
real
0
The angle 0° degree is at 3 0’clock. The angle is measured counterclockwise.
x
real
0
Position of the left edge in cm.
y
real
0
Position of the bottom edge in cm.
width
real
0
Chart width in cm.
height
real
0
Chart height in cm.
value_format
string
"%g %%"Is a format string. To display two decimal places: “%.2lf %%”. “%%” prints the percent symbol. See printf.
value_percent
real
1
If 1, the values are displayed as a number in percent.
values
real
0
Values for the chart. The values are converted to percent values. The pie function will fill this parameter with the values in the rvX parameter.
values_show
real
1
If set to 1, the slices are labelled with their values.
transparency
real
255
255: opaque, 127: half transparent, 0: transparent
title
string
""Is the chart title. Will be displayed in the upper left corner.
title_show
real
1
If set to 1 the title text will be displayed.
Example
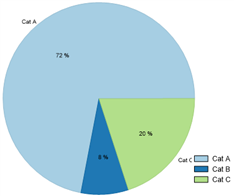
The following example will create a pie chart in a new document.
pie([0.1, 0.4, 0.2])
hPie = pie([72, 8, 20], [. title="2030", labels = ["Cat A", "Cat B", "Cat C"], color_scheme = "Blues", legend_show = 1])
pie_get_props
pie_get_props returns an object with the pie options (name/value pairs).
- props = pie_get_props(hText)
Return value
props is an object with parameters.
Parameter
- hText
hText is the handle of the pie chart (text object).
Example
* h = pie([72, 8, 20], [. title="2030", labels = ["Cat A", "Cat B", "Cat C"], color_scheme = "Blues", legend_show = 1])
* pie_get_props(h)
[.
    color_scheme = "Blues"
    colors = ""
    edge_color = "auto"
    edge_show = 1
    edge_width = 1
    explode[3;1] = [0, 0, 0]
    hPage = 29
    label_show = 1
    labels[3;1] = ["Cat A", "Cat B", "Cat C"]
    show_legend = 1
    show_legend_values = 0
    start_angle = 0
    subplot[1;4] = [1, 1, 2, 2]
    sweep_angle = 360
    table_uuid = "uuid:999ff6d8-c7a4-4a63-89ab-95570d17a1e2"
    title = "2030"
    title_show = 1
    transparency = 255
    value_format = "%g %%"
    value_percent = 1
    values[3;1] = [72, 8, 20]
    values_show = 1
]
object (obj at 0x72AEFF68)
pie_set_props
pie_set_props sets the pie options.
- bool = pie_set_props(hText, props)
Return value
bool
Parameter
- hText
hText is the handle of the pie chart (text object).
- props
props is an object with the parameters.
Comment
The pie function uses the new graphic interface. See g_create.
History
Version |
Description |
|---|---|
R2017 |
New. |
See also
DocCreate, PageCreate, PageGetParentDocument, LayerCreate, XYCreate, plotcategory, NC_plotcategory, GetParent, plot, g_create
id-1925613