g_graph
Create and close
g_create
g_create creates a UniPlot vector graphic meta file in memory.
The graphic is saved in a drawing object or dataset with g_close. It is plotted and saved with the object.
- ctx = g_create(hObject)
def _g_helper_new_text_doc(ssTitle, _rangeX, _rangeY)
{
if (nargsin() == 1) {
rangeX = [0,3,1]; rangeY = [0,3,1];
} else {
rangeX = _rangeX; rangeY = _rangeY;
}
hDoc = DocCreate();
hPage = PageCreate();
hLayer = LayerCreate();
LayerSetAxisMinMaxDelta(hLayer, "x", rangeX);
LayerSetAxisMinMaxDelta(hLayer, "y", rangeY);
LayerSetAxisTitle(hLayer, "x", "");
LayerSetAxisTitle(hLayer, "y", "");
PageAddLayer(hPage, hLayer)
DocAddPage(hDoc, hPage);
PageSetTitle(hPage, ssTitle+";0.6");
hText = TBCreate()
rv = OBJGetPosSize(hLayer)
OBJSetPosSize(hText, [rv[1], rv[2], 1, 1])
TBSetText(hText, "");
LayerAddObjects(hLayer, hText);
return hText;
}
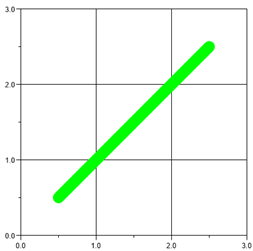
def test_g_create()
{
hText = _g_helper_new_text_doc("g_graph_1");
ctx = g_create(hText);
g_set_transformation(ctx, "WC");
g_set_line_width(ctx, 50);
g_set_source_rgb(ctx, [127, 0,255,0])
g_move_to(ctx, 0.5, 0.5);
g_line_to(ctx, 2.5, 2.5);
g_close(ctx);
}
g_close
g_close closes a UniPlot graphic meta fle and copies the bits into the obect specified with g_create.
- r = g_close(ctx)
g_set_transformation
g_set_transformation sets a transformation to world coordinaes or centimeter coordinates (ssType is “WC” or CM”).
- r = g_set_transformation(ctx, ssType)
Linien und Fächen
g_move_to
g_move_to sets the drawing pen to the specified position.
- r = g_move_to(ctx, x, y)
g_line_to
g_line_to adds a line to the active path starting from the current position to the specified coordinates.
- r = g_line_to(ctx, x, y)
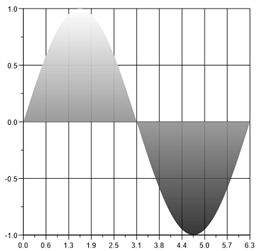
g_polyline
g_polyline adds lines to the active path.
- r = g_polyline(ctx, rvX, rvY)
def test_g_polyline()
{
    hText = _g_helper_new_text_doc("g_polyline", [0,2*PI, 2*PI/10], [-1,1,0.5]);

    ctx = g_create(hText);
    g_set_transformation(ctx, "WC");

    n = 1000;
    x = linspace(0, 2*PI, n);
    y = sin(x);

    g_set_line_width(ctx, 2);
    g_set_source_rgb(ctx, [255, 0,0,0]);
    g_polyline(ctx, x, y);
    g_stroke_preserve(ctx)

    p = g_pattern_create_linear(0, -1.1, 0, 1.1);
    g_pattern_add_color_stop_rgb(p, 0, [200, 0,0,0]);
    g_pattern_add_color_stop_rgb(p, 1, [255, 255,255,255]);
    g_set_source(ctx, p);
    g_fill(ctx);

    g_close(ctx);
}
g_ellipse
g_ellipse prints an ellipse.
- r = g_ellipse(ctx, rsX1, rsY1, rsX2, rsY2, rsXS, rsYS, rsXE, rsYE)
rect: rsX1, rsY1, rsX2, rsY2
start point: rsXS, rsYS
end point: rsXE, rsYE
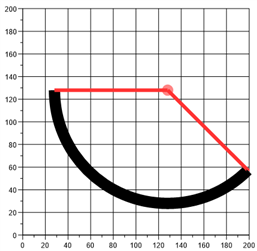
g_arc
g_arc adds an arc to the active path. rsX, rsY specify the bottom left corner of the rectangle with size rsWidth and rsHeigth.
- r = g_arc(ctx, rsX, rsY, rsWidth, rsHeight, rsStartAngle, rsSweepAngle)
def test_g_arc()
{
   hText = _g_helper_new_text_doc("g_4", [0,200,50], [0,200,50]);

   ctx = g_create(hText);
   g_set_transformation(ctx, "WC");

   xc = 128.0;
   yc = 128.0;
   radius = 100.0;
   angle1 = 180.0;
   angle2 = 135.0;

   g_set_line_cap(ctx, PS_ENDCAP_FLAT)
   g_set_line_join(ctx, PS_JOIN_MITER)
   g_set_line_width (ctx, 50.0);
   g_new_path(ctx)
   g_arc(ctx, xc-radius, yc-radius, 2*radius, 2*radius, angle1, angle2);
   g_stroke (ctx);

   /* draw helping lines */
   g_set_source_rgb (ctx, [0.6*255, 1.0*255, 0.2*255, 0.2*255]);
   g_set_line_width (ctx, 16.0);
   g_set_line_cap(ctx, PS_ENDCAP_FLAT)
   g_new_path(ctx)
   g_arc(ctx, xc-10/2, yc-10/2, 10.0, 10, 0, 360); // 2*M_PI);
   g_fill (ctx);

   g_arc(ctx, xc-radius, yc-radius, 2*radius, 2*radius, angle1, 0.01);
   g_line_to (ctx, xc, yc);
   g_stroke (ctx);

   g_arc(ctx, xc-radius, yc-radius, 2*radius, 2*radius, angle1+angle2, 0.011);
   g_line_to (ctx, xc, yc);
   g_stroke (ctx);

   g_close(ctx);
}
Path
g_new_path
g_new_path deletes the active path and creates a new path. This function is called by g_fill and g_stroke automatically.
- r = g_new_path(ctx)
g_close_path
g_close_path closes a path. The function adds a line from the last point to the first point.
- r = g_close_path(ctx)
g_stroke
g_stroke draws a line along the path. The function invokes g_new_path, which will deactivate the path.
- r = g_stroke(ctx)
g_stroke_preserve
g_stroke_preserve draws a line along the path without invoking g_new_path.
- r = g_stroke_preserve(ctx)
Siehe auch g_stroke, g_new_path, g_close_path
g_fill
g_fill fills a path. The function invokes g_new_path, which will deactivate the path.
- r = g_fill(ctx)
g_fill_preserve
g_fill_preserve fills a path without invoking g_new_path.
- r = g_fill_preserve(ctx)
Siehe auch g_fill, g_stroke, g_new_path, g_close_path
Lines and Color
g_set_source_rgb
g_set_source_rgb sets the color and transparency for lines and fillings.
- r = g_set_source_rgb(ctx, rvColor)
rvColor is a vector with 3 [R, G, B] or 4 [A, R, G, B] elements in
the range 0 to 255. [A, R, G, B]: A is the alpha value, 0, transparent, 255
is opaque, RGB: red, green, blue.
g_pattern_create_linear
g_pattern_create_linear creates a linear color gradient along the line (x0,y0) to (x1,y1).
- pattern = g_pattern_create_linear(x0, y0, x1, y1)
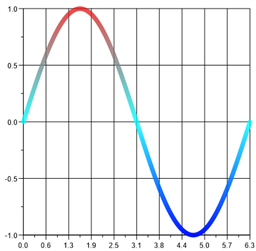
g_pattern_add_color_stop_rgb
g_pattern_add_color_stop_rgb adds color stops to the color gradient. The value of offset are between 0.0 und 1.0. The offset sets the position of a color inside the color gradient. See example.
- r = g_pattern_add_color_stop_rgb(pattern, offset, rvARGB)
def test_g_polyline_color()
{
    hText = _g_helper_new_text_doc("g_polyline_color", [0,2*PI, 2*PI/10], [-1,1,0.5]);

    ctx = g_create(hText);
    g_set_transformation(ctx, "WC");

    n = 1000;
    x = linspace(0, 2*PI, n);
    y = sin(x);

    g_set_line_width(ctx, 20);
    g_polyline(ctx, x, y);

    p = g_pattern_create_linear(0, -1.1, 0, 1.1);
    g_pattern_add_color_stop_rgb(p, 1, [200, 255,0,0]);
    g_pattern_add_color_stop_rgb(p, 0.5, [200, 0,255,255]);
    g_pattern_add_color_stop_rgb(p, 0, [255, 0,0,255]);
    g_set_source(ctx, p);
    g_stroke(ctx);

    g_close(ctx);
}
g_pattern_destroy
g_pattern_destroy destroys a color gradient.
- r = g_pattern_destroy(pattern)
g_set_source
g_set_source sets a color gradient created with g_pattern_create_linear.
- r = g_set_source(ctx, pattern)
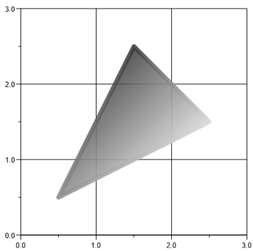
def test_g_pattern()
{
    hText = _g_helper_new_text_doc("g_pattern");

    ctx = g_create(hText);
    g_set_transformation(ctx, "WC");

    p = g_pattern_create_linear(0.5, 2, 2, 0.5);
    g_pattern_add_color_stop_rgb(p, 0, [200, 0,0,0]);
    g_pattern_add_color_stop_rgb(p, 1, [255, 255,255,255]);

    g_new_path(ctx);
    g_polyline(ctx, [0.5,2.5,1.5], [0.5, 1.5, 2.5]);
    g_close_path(ctx);

    g_set_line_width(ctx, 20);
    g_set_source_rgb(ctx, [0, 0,255,0])
    g_stroke_preserve(ctx);

    g_set_source(ctx, p);
    g_fill(ctx);

    g_close(ctx);
}
g_set_line_width
g_set_line_width sets the line width in 0.1 mm steps.
- r = g_set_line_width(ctx, width)
g_set_line_style
g_set_line_style sets the line style.
- r = g_set_line_style(ctx, style)
PS_SOLID           0
PS_DASH            1
PS_DOT             2
PS_DASHDOT         3
PS_DASHDOTDOT      4
PS_NULL            5
g_set_line_cap
g_set_line_cap sets the line cap.
- r = g_set_line_cap(ctx, linecap)
PS_ENDCAP_ROUND     0x00000000
PS_ENDCAP_SQUARE    0x00000100
PS_ENDCAP_FLAT      0x00000200
g_set_line_join
g_set_line_join sets the line join.
- r = g_set_line_join(ctx, linejoin)
PS_JOIN_ROUND       0x00000000
PS_JOIN_BEVEL       0x00001000
PS_JOIN_MITER       0x00002000
Marker
g_set_marker
g_set_marker sets a marker style.
oMarker = [. "edge-color" = "black", "edge-width" = 1, "fill-color" = "red",
             size = 0.2, style = "circle"];
- r = g_set_marker(ctx, oMarker)
g_marker
g_marker plots markers at the specified position. rvX and rvY are vectors of the same length.
- r = g_marker(ctx, rvX, rvY)
Texte
g_text
g_text plots text.
- r = g_text(ctx, ssText, rvRect, nAttrib)
G_TEXT_CLIP       1
G_TEXT_WORDWRAP   2
G_TEXT_SHRINK     4
g_set_font_handle
g_set_font_handle sets a font.
- r = g_set_font_handle(ctx, hfont)
g_set_font
g_set_font sets a font.
oFont = [. "face-name" = "Arial", size = 12, weight = 400, "pitch-and-family" = 49,
        underline = 0, italic = 0, "strike-out" = 0, angle = 0, color = "black"];
- r = g_set_font(ctx, oFont)
History
Version |
Description |
|---|---|
R2017 |
New. |
See also
id-1761312