XYZCreate
XYZCreate creates a new 3D dataset. The 3D dataset can be created from scattered XYZ triples or from a rectangular grid (matrix).
- hData = XYZCreate(ssName, rvX, rvY, rvZ)
- hData = XYZCreate(ssName, rvX, rvY, rvZ, bIsoScale)
- hData = XYZCreate(ssName, rvX, rvY, rvZ, bIsoScale, svWOT)
- hData = XYZCreate(ssName, rvX, rvY, rmZMatrix)
- hData = XYZCreate(ssName, rvX, rvY, rmZMatrix, bIsoScale)
- hData = XYZCreate(ssName, rmZMatrix, rvRect)
Return Value
hData is the handle of the dataset. If the dataset cannot be created hData is 0.
Parameters
- ssName
ssName is a scalar string.
- rvX
rvX is a vector with x-coordinates.
- rvY
rvY is a vector with y-coordinates.
- rvZ
rvZ is a vector with z-coordinates.
- rmZMatrix
rmZMatrix is a matrix with z-coordinates. If the distance between the rows and columns of the matrix is constant, the x- and y-coordinates can be specified with the rvRect parameter. If the rows and columns are not evenly spaced, the coordinates of the matrix columns are specified by the vector rvX and the rows are specified by the vector rvY. rvX and rvY should be sorted in ascending order. If they are not sorted the function will sort the vectors and the z matrix. If the matrix contains invalid values (1e10 or NANs), the missing points will be interpolated. The invalid values at the edges are used to calculate the data hull.
- rvRect
rvRect specifies the range of the z Matrix in the xy plane.
Value
Meaning
rvRect[1]
xmin of the first matrix column
rvRect[2]
ymin of the first matrix row
rvRect[3]
xmax of the last matrix column
rvRect[4]
ymax of the last matrix row
- bIsoScale
bIsoScale is TRUE (1), if isolines should be automatically created for the dataset, and FALSE (0), when no isolines should be created. If the function is called with 4 parameters TRUE will be used for bIsoScale.
- svWOT
svWOT is a string vector that sets the Full Load Line (WOT). Each vector element contains a symbol and can have one of the following values
"a","e","v","A","E","V","". The symbols have the following meanings:Value
Meaning
"a"Start of the Full Load Line (WOT) without labels.
"e"End of the Full Load Line (WOT) without labels.
"v"Point belongs to Full Load Line (WOT) and will not be labeled.
"A"Start of the Full Load Line (WOT) with labels.
"E"End of the Full Load Line (WOT) with labels.
"V"Point belongs to Full Load Line (WOT) and will be labeled.
""(empty string) Point does not belong to Full Load Line (WOT).
Comment
All vectors must have the same number of elements for XYZ triples. The triples can be scattered in the x/y plane. At least three triples are necessary to create a 3D dataset. If the function is called without the parameter svWOT, a convex hull is calculated.
If the dataset is created from a matrix, the data hull can be specified by using the function XYZSetHullNewData.
Before the dataset is created the triple points are filtered. This filter categorize the data into 100 by 100 bins in the x- and y-direction. For each bin only one data point, the “median” point, is used. For a grid of 100 by 100 bins, the number of data points is reduced to 10,000 data points. Because not all bins contain points the number is usually smaller. If all points lie on a straight line, only 100 points are returned.
To disable the filter, invoke the following function call in the command window:
WriteProfileInt("Settings", "XYZFilterCallback_enable", 0);
To enable the filter:
WriteProfileInt("Settings", "XYZFilterCallback_enable", 1);
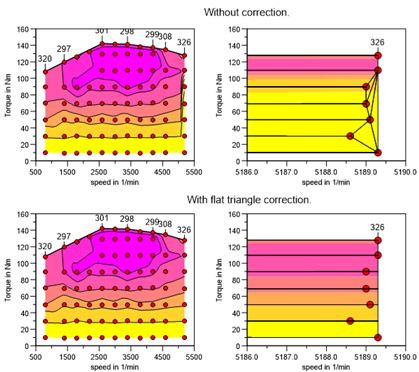
Map correction at the map border
The linear and non-linear interpolation is based on a triangulation of the data points in the X/Y plane. If boundary points are nearly collinear or coplanar the triangulation process can lead to neary flat triangles near the map border. This will cause unexpected isolines shapes at the border.
The following example shows in the two upper graphs the course of the Contours with uncorrected data and in the lower two charts the course of the corrected data. Data points near the data hull will be moved perpendicular to the hull.
The correction can be disabled Tools=>More Options. The default value is “switched on”. A tolerance to find the data points at the border can be set. The default value is 0.1 % of the data range. Example: The tolerance for speed values in the range 500 to 6500 rpm is 6 rpm.
The setting can be switched off via script as following
WriteProfileInt("Settings", "XYZRemoveFlatTriangles", 0);
Enable:
WriteProfileInt("Settings", "XYZRemoveFlatTriangles", 1);
Example
Copy the following example into an UniPlot Editor (File=>New
[Program editor]) and choose UniScript=>Save/Execute to execute the
script.
A 2 by 3 matrix dataset will be created. The x-coordinates specify the columns and the y-coordinates the matrix rows.
x = [1, 1.5, 2]
y = [1, 5]
z = [1, 1, 3;
    1, 2, 3]
hData = XYZCreate("Test", x, y, z);
if (hData == 0) {
    error();
}
hLayer = LayerCreate();
hDoc = DocCreate();
hPage = PageCreate();
DocAddPage(hDoc, hPage);
PageAddLayer(hPage, hLayer);
LayerAddDataset(hLayer, hData);
LayerAutoScale(hLayer);
PageReplot(hPage);
History
Version |
Description |
|---|---|
R2016.1 |
Nearly flat triangle corrected added. |
5.3.4 |
Function call with three parameters fixed: |
See also
Overview XYZ-Datasets, Overview Data File Informations for Datasets, LayerAddDataset, XYZDestroy, XYZCreateFromMatrix, XYZGetMatrixRange, XYZGetMatrix, XYZGetData, XYZGetMatrixRowData, XYZGetMatrixColData, reduce3d
id-428507