XYZSetProps
XYZSetProps sets the dataset properties of a 3D dataset.
- bool = XYZSetProps(hData, ssProps)
Return Value
If the function succeeds, the return value bool is TRUE (1); otherwise it is FALSE (0).
Parameters
- hData
Is the handle of a dataset created with XYZCreate.
- ssProps
ssProps is a scalar string with
NAME='VALUE'-pairs. Each pair sets one property. The property pairs are separated by a blank, a newline or a tab character.
Example
The following example sets the bubble plot option and turns off the isolines. All other properties are not changed.
XYZSetProps(hData, "bubble='1' isolines='0'")
Calculates isolines and sets lables the isolines at random positions (one label per iso line):
XYZSetProps(hData, "iso-values='auto' iso-label-type='auto'")
Another Example:
XYZSetProps(hData, "hull-label-distance='0.2' " + ...
        "marker='1' marker-label='0' " +  ...
        "iso-pen-color='silver' iso-values = 'auto:15' " + ...
        "iso-label-type ='random'");
Set iso line colors:
rmColor = [255,0,0;  255,127,0;  0,255,0;  0,0,255];
// the last color (blue) will be used for all remaining iso lines
// (5., 6., etc.).
ssColor = sty_RGB_to_prop_color(rmColor);
ssProp = sprintf("iso-pen-color = '%s'", ssColor);
XYZSetProps(hData, ssProp);
Comment
The following table contains all properties of a 3D dataset. The column Type contains the valid value range. A property can have one of the following data types: bool, int, double, color, curve_style, marker_style.
bool is the value ‘0’ or ‘1’. ‘0’ means the off, false and’1’ means on or true.
int is an in integer number (‘1’, ‘-1’, ‘144’).
double is a real number like ‘1.23’, ‘5000’, ‘1e3’.
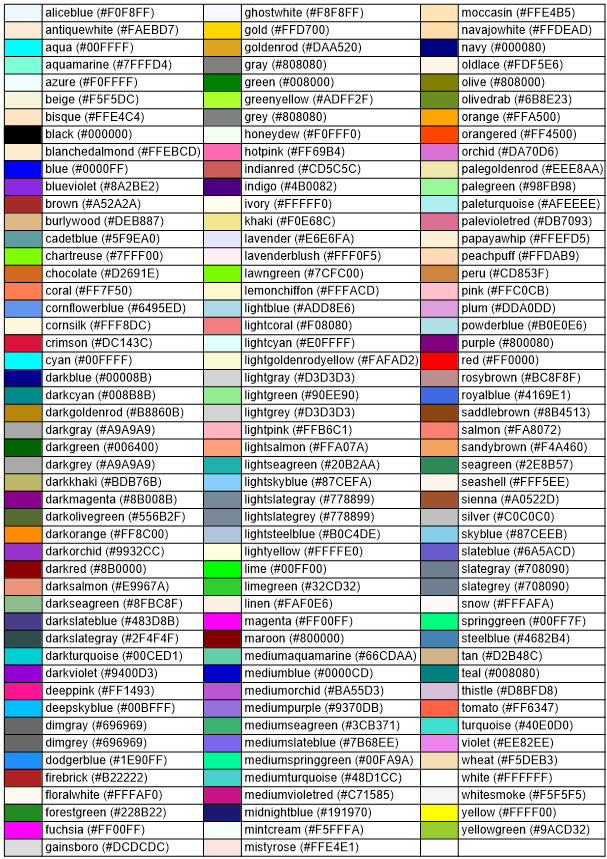
color is a name like ‘mediumblue’ (see color table), or a value like ‘#0000CD’ or an expression of the form ‘rgb(0,0,205)’.
curve_style can be ‘solid’ (or ‘0’), ‘dash’, ‘dot’, ‘dashdot’, ‘dashdotdot’ ( or ‘4’).
Properties in alphabetic order:
Property |
Type |
Default Value |
Comment |
|---|---|---|---|
base-value-3d |
double |
|
|
bubble |
bool |
|
|
bubble-color-type |
int |
|
|
bubble-size-max |
double |
|
Max bubble size in centimeter. |
bubble-size-min |
double |
|
Min bubble size in centimeter. |
bubble-scale-max |
double |
|
Is used to set the max value instead of the data max value, if
|
bubble-scale-min |
double |
|
Is used to set the min value instead of the data min value, if
|
bubble-size-type |
int |
|
1: diameter, 2: area |
bubble-no-edge |
int |
|
If set to 1 an edge line is displayed. |
bubble-use-scaleval |
int |
|
If set to 1 the min/max scale value is used to calculate the bubble size. |
color-matrix |
bool |
|
|
color-matrix-line-color |
color |
‘black’ |
|
color-matrix-line-width |
int |
|
|
color-matrix-showzval |
bool |
|
|
color-matrix-cliptext |
bool |
|
|
color-matrix-shrinktext |
bool |
|
|
color-matrix-showedge |
bool |
|
|
color-matrix-clipzmin |
bool |
|
|
filled |
bool |
|
|
hull-label |
bool |
|
|
hull-label-distance |
double |
|
distance in centimeters |
hull-label-horizontal |
bool |
|
|
hull-pen-color |
color |
|
|
hull-pen-style |
curve_style |
|
possible values: ‘0’ or ‘solid’ , ‘1’ or ‘dash’, ‘2’ or’dot’, ‘3’ or ‘dashdot’, ‘4’ or ‘dashdotdot’. |
hull-pen-width |
int |
|
|
hull-spline |
bool |
|
|
hull-type |
int |
|
|
inside-3d-pen-color |
color |
|
|
inside-3d-pen-style |
curve_style |
|
possible values: ‘0’ or ‘solid’ , ‘1’ or ‘dash’, ‘2’ or’dot’, ‘3’ or ‘dashdot’, ‘4’ or ‘dashdotdot’. |
inside-3d-pen-width |
int |
|
|
inside-color-3d |
color |
|
|
interpolation-density |
string |
|
|
interpolation-on-grid |
bool |
|
|
interpolation-range |
string |
|
|
interpolation-smooth-factor |
int |
|
|
interpolation-type |
int |
|
‘1’ (linear Interpolation), ‘2’ (Non linear Interpolation), ‘3’ (Thin-Plate-Spline Interpolation) |
iso-colors |
string |
|
|
iso-colors-alpha |
string |
|
Scalar or comma separated list of alpha values. |
iso-colormap |
string |
|
|
iso-colormap-enable |
bool |
|
|
iso-label-type |
string |
|
|
iso-min-color |
string |
|
|
iso-min-color-alpha |
string |
|
Alpha value for for min color. |
iso-pen-color |
string |
|
|
iso-pen-styles |
string |
|
possible values: ‘0’ or ‘solid’ , ‘1’ or ‘dash’, ‘2’ or’dot’, ‘3’ or ‘dashdot’, ‘4’ or ‘dashdotdot’. |
iso-pen-width |
string |
|
|
iso-values |
string |
|
|
isolines |
bool |
|
|
isolines-3d |
bool |
|
|
label-font-angle |
double |
|
|
label-font-color |
color |
|
|
label-font-face-name |
string |
|
|
label-font-height |
int |
|
|
label-font-italic |
bool |
|
|
label-font-pitch-and-family |
int |
|
|
label-font-strikeout |
bool |
|
|
label-font-underline |
bool |
|
|
label-font-weight |
int |
|
|
label-format |
string |
|
|
label-in-a-box |
bool |
|
|
label-in-line-color |
int |
|
|
label-transparent |
bool |
|
|
label-orientation |
int |
|
|
marker |
bool |
|
|
marker-edge-color |
color |
|
|
marker-edge-width |
int |
|
|
marker-fill-color |
color |
|
|
marker-fill-alpha |
int |
|
|
marker-label |
bool |
|
|
marker-label-font-angle |
double |
|
|
marker-label-font-color |
color |
|
|
marker-label-font-face-name |
string |
|
|
marker-label-font-height |
int |
|
|
marker-label-font-italic |
int |
|
|
marker-label-font-pitch-and-family |
int |
|
|
marker-label-font-strikeout |
int |
|
|
marker-label-font-underline |
int |
|
|
marker-label-font-weight |
int |
|
|
marker-line-index |
bool |
|
|
marker-size |
double |
|
|
marker-style |
marker_style |
|
|
max-marker |
bool |
|
|
max-marker-edge-color |
color |
|
|
max-marker-edge-width |
int |
|
|
max-marker-fill-color |
color |
|
|
max-marker-fill-alpha |
int |
|
|
max-marker-size |
double |
|
|
max-marker-style |
marker_style |
|
See XYSetProps |
min-marker |
bool |
|
|
min-marker-edge-color |
color |
|
|
min-marker-edge-width |
int |
|
|
min-marker-fill-color |
color |
|
|
min-fill-alpha |
int |
|
|
min-marker-size |
double |
|
|
min-marker-style |
marker_style |
|
See XYSetProps |
name |
string |
|
|
outside-3d-pen-color |
color |
|
|
outside-3d-pen-style |
curve_style |
|
possible values: ‘0’ or ‘solid’ , ‘1’ or ‘dash’, ‘2’ or’dot’, ‘3’ or ‘dashdot’, ‘4’ or ‘dashdotdot’. |
outside-3d-pen-width |
int |
|
|
outside-color |
color |
|
|
outside-hull-3d-type |
int |
|
|
scatter-bar-width |
double |
|
|
scatter-label-offset-x |
double |
|
|
scatter-label-offset-y |
double |
|
|
spline |
bool |
|
|
surface-attributes |
int |
|
|
surface-type |
int |
|
|
triangulation |
bool |
|
Properties in Categories:
Isolines
Property |
Type |
Default Value |
|---|---|---|
isolines |
bool |
|
spline |
bool |
|
iso-values |
string |
|
filled |
bool |
|
iso-min-color |
string |
|
iso-min-color-alpha |
int |
|
iso-colors |
string |
|
iso-colors-alpha |
string |
|
iso-pen-color |
string |
|
iso-pen-styles |
string |
|
iso-pen-width |
string |
|
Note:
iso-values specifies the isolines to be plotted. iso-values is either
the string “auto” or a string of comma separated values (“22.3,25,100,200,500.12”).
The “auto” string can be followed by a colon and the number of
automatically calculated isoline values in the range 1 to 100, e.g. “auto:6”.
The text “auto:linear,XX” creates a linear scaling. XX is the number of values,
e. g. “auto:linear,10”.
iso-min-color is used when “filled=’1’” is set.
iso-colors is a single color or a comma separated list of colors. If iso-values is set to ‘auto’ the iso-min-color and the last specified color is used to calculate a color gradient. If iso-values is a list of values the number of iso-colors must match the number of isoline values otherwise a color gradient between the last specified color and the iso-min-color is calculated.
iso-pen-color, iso-pen-styles, iso-pen-width are comma separted list of values. If the number of elements do not match the number of isoline values the list will be filled with the last specified value in the list.
Isoline Labels
Property |
Type |
Default Value |
|---|---|---|
iso-label-type |
string |
|
label-format |
string |
|
label-in-a-box |
bool |
|
label-in-line-color |
int |
|
label-transparent |
int |
|
label-orientation |
int |
|
label-font-angle |
double |
|
label-font-color |
color |
|
label-font-face-name |
string |
|
label-font-height |
int |
|
label-font-italic |
bool |
|
label-font-pitch-and-family |
int |
|
label-font-strikeout |
bool |
|
label-font-underline |
bool |
|
label-font-weight |
int |
|
Note:
iso-label-type set the label position.
Value |
Meaning |
|---|---|
‘none’ or ‘0’ |
isolines are not labeled. |
‘user’ or ‘1’ |
labels are not changed. |
‘stripes’ or ‘2’ |
labels the isolines at the intersection between two vertical lines and the isolines. |
‘middle’ or ‘3’ |
every isoline is labeld in the middle of the line. |
‘random’ or ‘4’ |
labels each line at an random position. |
‘auto’ or ‘5’ |
same as ‘random’. |
label-format ‘auto’ or a number (see XYZSetLabelFormat).
label-transparent If set to ‘1’, the label will be plotted transparent. If set to ‘0’ the labels will be plotted with a white background rectangle.
Bubble-Plots
Property |
Type |
Default Value |
|---|---|---|
bubble |
bool |
|
bubble-color-type |
int |
|
bubble-size-max |
double |
|
bubble-size-min |
double |
|
bubble-size-type |
int |
|
Note:
bubble-color-type ‘1’ solid color, ‘2’ color gradient.
bubble-size-type ‘1’ z-value proportional to the marker area, ‘2’ z-value proportional to the marker diameter.
Hull
Property |
Type |
Default Value |
|---|---|---|
hull-label |
bool |
|
hull-label-distance |
double |
|
hull-label-horizontal |
bool |
|
hull-pen-color |
color |
|
hull-pen-style |
curve_style |
|
hull-pen-width |
int |
|
hull-spline |
bool |
|
hull-type |
int |
|
Note:
hull-type sets the hull type.
Value |
Meaning |
|---|---|
‘0’ |
No hull (HULL_NONE) |
‘1’ |
North part of the hull (HULL_NORTH) |
‘2’ |
Spline connection (HULL_NORTH_SPLINE) |
‘3’ |
Entire hull (HULL_ENTIRE) |
‘4’ |
Entire hull - North part with spline connection (HULL_ENTIRE_SPLINE) |
‘5’ |
User defined hull (HULL_USERDEF) |
3D Surface Plot
Property |
Type |
Default Value |
|---|---|---|
base-value-3d |
double |
|
inside-3d-pen-color |
color |
|
inside-3d-pen-style |
curve_style |
|
inside-3d-pen-width |
int |
|
inside-color-3d |
color |
|
outside-3d-pen-color |
color |
|
outside-3d-pen-style |
curve_style |
|
outside-3d-pen-width |
int |
|
outside-color |
color |
|
outside-hull-3d-type |
int |
|
surface-attributes |
int |
|
surface-type |
int |
|
isolines-3d |
bool |
|
Note:
surface-type sets the surface type (see XYZSet3DSurfaceType). Valid range is ‘0’ to ‘7’.
Interpolation
Property |
Type |
Default Value |
|---|---|---|
interpolation-density |
string |
|
interpolation-on-grid |
bool |
|
interpolation-range |
string |
|
interpolation-smooth-factor |
int |
|
interpolation-type |
int |
|
Meaning of the property interpolation-type:
Value |
Meaning |
|---|---|
1 |
linear Interpolation |
2 |
Non linear Interpolation |
3 |
Thin-Plate-Spline Interpolation |
Scatter Plot
Property |
Type |
Default Value |
|---|---|---|
marker |
bool |
|
marker-edge-color |
color |
|
marker-edge-width |
int |
|
marker-fill-color |
color |
|
marker-fill-alpha |
int |
|
marker-label |
bool |
|
marker-label-font-angle |
double |
|
marker-label-font-color |
color |
|
marker-label-font-face-name |
string |
|
marker-label-font-height |
int |
|
marker-label-font-italic |
int |
|
marker-label-font-pitch-and-family |
int |
|
marker-label-font-strikeout |
int |
|
marker-label-font-underline |
int |
|
marker-label-font-weight |
int |
|
marker-line-index |
bool |
|
marker-size |
double |
|
marker-style |
marker_style |
|
max-marker |
bool |
|
max-marker-edge-color |
color |
|
max-marker-fill-alpha |
int |
|
max-marker-edge-width |
int |
|
max-marker-fill-color |
color |
|
max-marker-size |
double |
|
max-marker-style |
marker_style |
|
min-marker |
bool |
|
min-marker-edge-color |
color |
|
min-marker-edge-width |
int |
|
min-marker-fill-color |
color |
|
min-marker-fill-alpha |
int |
|
min-marker-size |
double |
|
min-marker-style |
marker_style |
|
Color Matrix
Property |
Type |
Default Value |
|---|---|---|
color-matrix |
bool |
0 |
color-matrix-line-color |
color |
|
color-matrix-line-width |
int |
|
color-matrix-showzval |
bool |
|
color-matrix-cliptext |
bool |
|
color-matrix-shrinktext |
bool |
|
color-matrix-showedge |
bool |
|
color-matrix-clipzmin |
bool |
|
Others
Property |
Type |
Default Value |
|---|---|---|
name |
string |
|
scatter-bar-width |
double |
|
scatter-label-offset-x |
double |
|
scatter-label-offset-y |
double |
|
triangulation |
bool |
|
Note:
Information to the column Type can be found in the XYSetProps function help.
For more information open the file script\do_sty4.ic.
Color Table
History
Version |
Description |
|---|---|
5.30 |
New attributes (Color matrix). |
4.0.3 |
New. |
See also
Overview XYZ-Datasets, XYZGetProps, XYZSetDefault, XYSetProps
id-1762688