How do I do rainflow counting or range counting on a load signal?
UniPlot offers two ways. The filter function range_counting() counts the
ranges between successive extreme values according to DIN 45667 and works
directly on a curve. The Rainflow add-in performs a complete rainflow counting
and fills a template with the rainflow matrix and several histograms.

Load signal and the sorted ranges calculated with range_counting().
How it works
Range counting with a filter
Right-click the load or stress curve and choose Edit Filter Functions.
Add
range_counting(rsThreshold, nType). Ranges smaller than rsThreshold are ignored. nType 1 counts all ranges, 2 only positive and 3 only negative ranges.To get the distribution, add
histogram()after it, for examplerange_counting(5, 1);histogram(1, 0, 0, 20).
Rainflow counting with the add-in
Choose Tools=>Add-In Manager and activate Rainflow-counting algorithm. After a restart the user toolbar has a Rainflow… button.
Load the stress data into a diagram, for example stress over time, and select the curve.
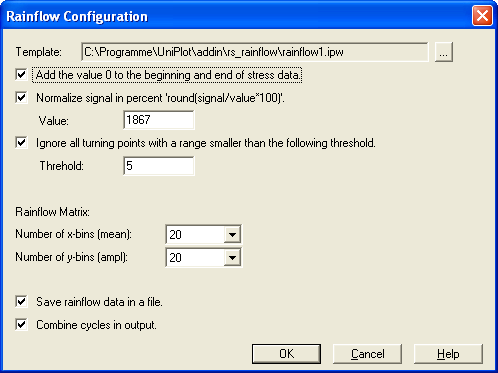
Click Rainflow… and choose the options: normalize the signal in percent, ignore cycles below a threshold, combine identical cycles in the output.
UniPlot fills the template
rainflow1.ipwwith the original data, the ranges, the rainflow matrix and histograms of amplitude, mean and maximum values.
Why it helps
No separate fatigue tool: the counting runs on the curve you already have in UniPlot.
The filter is stored in the dataset, so the same evaluation is repeated automatically for the next load file.
The template can be adapted to your own report layout.
Good to know
The template diagrams must keep their names (
RF-Matrix,RF-Hist-Ampli, …). The add-in uses them to place the results.For scripts and batch runs, the add-in can be called with
Rainflow_Batch().Use a smoothing filter before counting if the signal is noisy, or set the threshold so that noise cycles are ignored.