Rainflow Counting
The Addin RS_RAINFLOW is an extension for UniPlot to execute a rainflow counting algorithm.
Installation
Open the Addin Manager (Tools=>Add-In Manager) and mark the Addin
Rainflow-counting algorithm.
After restart the User Toolbar should contain one new button: “Rainflow…”.
Usage
Load the stress data into a diagram, e.g. stress vs. time.
Select the new curve and click the Rainflow… button.
The following dialog box will be displayed:
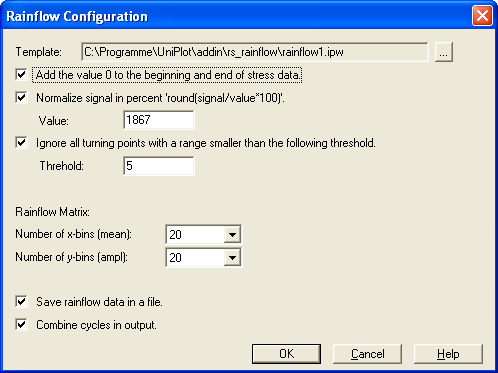
Normalize signal in percent ‘round(signal/value*100’): If this option is selected the rainflow cycles will be normalized in percent and rounded to the nearest integer.
Ignore all turning points with a range smaller than the following threshold: If this option is selected all rainflow cycles are removed, if the range is smaller than the given threshold:
abs(Max-Min) > threshold). If the data is normalized the threshold must be specified in percent. Otherwise it is specified in the stress data units.Combine cycles in output: If the option is selected the the number of occurrences of cycles with identical Min/Max values is calculated and printed in the last column of the data table.
Template
An example template can be found in the \uniplot\addin\rs_rainflow
directory. The template’s name is rainflow1.ipw. You can modify the
template or use it to create a new template. Do not change diagram names.
The names are used in the UniScript file.
The following diagrams are supported:
Diagram Name |
Meaning |
|---|---|
RF-DutyCycle |
Range (Min-Max) |
RF-Hist-Ampli |
Amplitude Histogram |
RF-Hist-Mean |
Average Histogram |
RF-Matrix |
Rainflow Matrix |
RF-StressData |
Original Data |
RF-Hist-Max |
Maximum Value Histogram |
UniScript Interface
See Rainflow_Batch.
Problems
If you have any problems using the addin please do not hesitate to contact us.
id-2006200