Insert Datasets into a Template
In this article a function is described which will simplify to addition of datasets to a UniPlot document (UniPlot template).
Function: An Excel sheet is created from a UniPlot document using the command Export Dataset Table.
Example:
The Excel sheet can be edited and then assigned to a copy of the original Uniplot document.
This is a quick way to create documents with different data files with added or changed channels.
Software
You need Microsoft-Excel 97 or higher.
Setup
Go to Tools=>Customize User Toolbar and add the following commands
Command Description
Export Dataset Table
To export a dataset table
- Open a UniPlot document.
- Choose Export Dataset Table from the user toolbar.
A dataset table will be written to an Excel file. The Excel file will be saved
under the name of the UniPlot document with the extension .xls. Example:
UniPlot document: c:\Program Files\UniPlot\Template\dx.ipw
Excel-Dataset-Table: c:\Program Files\UniPlot\Template\dx.xls
If the file could be created successfully it will be opened with Excel. See The Data Source Table.
Open Dataset Table
This command will try to open the Excel table of the active UniPlot document.
Example:
If the active document is c:\Program Files\UniPlot\Template\dx.ipw
the function will try to open the Excel file
c:\Program Files\UniPlot\Template\dx.xls.
Assign Data Source Table
After a Data Source Table has been created it can be applied to the active document:
Open the UniPlot document in which you would like to exchange or add datasets.
Make sure a Data Source Table exists. Choose the command Open Dataset Table.
Choose the command Assign Data Source Table from the user toolbar.
If the document has not jet been saved a message box will be displayed. Click on the Yes button to save the document.
A message box with a warning will pop up:
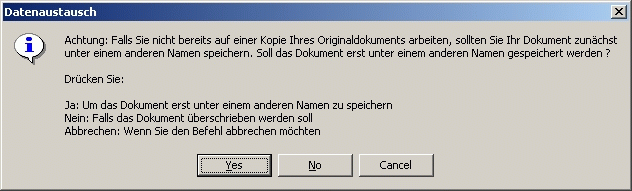
If you click on the Yes button you can save the document under a new name.
If you click No the data will be exchanged in the active document.
The following actions will be performed:
- All datasets in the UniPlot document will be deleted.
- The data files will be loaded and the specified datasets will be created. The specified functions will be executed..
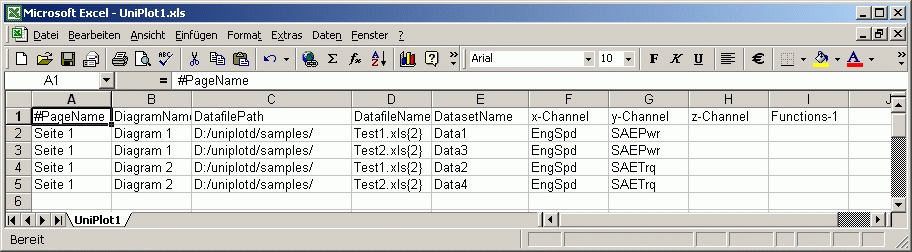
The Data Source Table
The Data Source Table has the following setup:
Column 1 to 4:
| #Page-Name | Diagram-Name | Datafile-Path | Datafile-Name |
|---|---|---|---|
| Page 1 | Diagram1 | D:/uniplotd/samples/ | Test1.xls{2} |
| Page 1 | Diagram1 | D:/uniplotd/samples/ | Test5.xls{2} |
Columns 5 bis 9:
| Dataset-Name | x-Channel | y-Channel | z-Channel | Functions |
|---|---|---|---|---|
| Data1 | EngSpd | SAEPwr | xy_akimaspline() | |
| Data2 | EngSpd | SAEPwr | xy_akimaspline() |
The first row is a comment line which starts with a # character. Comments will be ignored. Every other row specifies one dataset.
The columns have the following meaning:
Page-Name
Is the page name into which the dataset is inserted.
Diagram-Name
Is the diagram name into which the dataset is inserted.
Datafile-Path
Is the complete path of the data file. UNC path names are valid, e.g.
\\p1300\d\testdata\ao2230.
Datafile-Name
Is the data file name without the path. If the data file is an Excel file a sheet
name in square brackets can follow the file name. The import options can follow
in parenthesis. Example: test.xls [Sheet 1] 2.
Dataset-Name
Is the dataset name.
x-Channel
Is the x-channel name.
y-Channel
Is the y-channel name.
z-Channel
Is the z-channel name. If this column is not empty a 3D dataset is created.
Functions
In this column functions can be inserted which will be called after the dataset is created. If you would like to call multiple functions add them to the following columns (Col 10, 11, ..).
Function List
styleorder
styleorder("default")
This function sets the dataset style of the current page.
The style order can be configured using the command Tools=>Dataset Style Order Configuration.
If a document page contains 4 channels (Speed, Torque, etc.) and the datasets are loaded from 5 different data files, you can specify the dataset styles to distinguish the tests and channels. To to so, add a function call with the name of a style order name.
The function call should be added to the last dataset of the current page.
| #PageName | … | Function |
|---|---|---|
| Page 1 | … | |
| Page 1 | … | |
| Page 1 | … | styleorder(“default”) |
| Page 2 | … | |
| Page 2 | … | |
| Page 2 | … | styleorder(“default”) |
style
style(ssStyleName)
style(ssStyleFile, ssStyleName)
Example: style(“3D-be”)
This function is used mainly for 3D datasets. For 2D datasets the styleorder()
function is easier to use because you can set the style of all datasets with a
single function call.
xy_akimaspline
Creates an akima spline
xy_akimaspline()
xy_akimaspline(nPoints)
xy_akimaspline(nPoints, bIncludeOrgPoints)
Example: xy_akimaspline(100)
xy_fitspline
Creates a fit spline
xy_fitspline()
xy_fitsplinespline(nPoints)
xy_fitspline(nPoints, SmoothFactor)
Example: xy_fitspline(100)
User Functions for Data Source Table
This chapter is only intended for users who would like to write their own
functions such as the function styleorder. The functions above can be
found in the file dx-fkts.ic and can be used as examples for your own
functions. User functions should be added to a separate file e.g.
MyDataExchangeFunctions.ic and saved in the UniPlot/AutoLoad
directory.
Example:
// styleorder(ssStyleOrderName)
def DXFUNC_styleorder(hInfo, nArgs, svArgs)
{
    hPage = MapLookup(hInfo, "hPage");
    auto_AssignStyleOrder(hPage, svArgs[1]);
}
The function starts with the name DXFUNC_ followed by a name used in the
Data Source table.
The functions has three parameters: hInfo, nArgs und svArgs.
hInfo is the handle of a map with information about a row in the table which is currently processed. Here is a list of all data that is saved in the map:
hDoc = MapLookup(hInfo, "hDoc");
hPage = MapLookup(hInfo, "hPage");
hLayer = MapLookup(hInfo, "hLayer");
hData = MapLookup(hInfo, "hData");
nArgs is the number of arguments. Example: If the table contains the
function call styleorder("default2") nArgs has the value 1.
svArgs contains the arguments as a string vector. Example:
For the function call styleorder("default2") the parameter value is
svArgs = ["default2"].
id-962442