Tools=>Dataset Style Order Configuration
Sets the plot parameters of a 1D/2D curve in the entire page.
To open the dialog box choose Tools=>Dataset Style Order Configuration.
To apply the style to the active page choose a style beginning with AUTO:
from the style combo box in the toolbars, e.g.``AUTO:Default``
(see Toolbar=>Dataset Style).
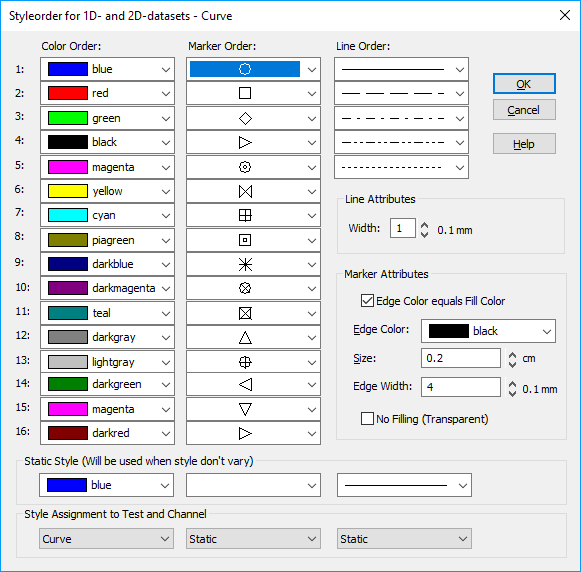
- Color Order
- The order of 16 colors can be set. The colors beginning with the first color can be set to tests or channels.
- Marker Order
- The order of 16 markers can be set. The markers beginning with the first marker can be set to tests or channels.
- Line Order
- The order of 5 line styles can be set. The line styles beginning with the first style can be set to tests or channels.
- Static Style
- In this group the color, marker and line styles can be selected to be used if the attribute does not vary. This style is used when in the Style Assignment the Static key word is selected.
- Style Assignment
In this group the assignment of color, marker and line style to tests or channels is set. To each attribute order (color, maker, line) a
Test,Channel,Curveor the key wordStaticcan be assigned. A test contains a number of channels. Example: If you chooseTestin the color column all datasets created from the first file (test) would be displayed in the first color, all datasets from the second file in the second color and so on.If you choose
Curvein the color column, the first curve will be displayed in the first color, the second curve in the second color and so on.If you select
Staticfor color order all datasets will use the static color.The assignment or marker and line style work accordingly.
- Line Attibutes
- In this group the line width can be set in steps of 0.1 mm. The line width for all datasets is equal.
- Marker Attributes
- In this group the marker attributes can be set. Marker attributes are the same for all datasets.
Comment
The style order data is saved in a file with the extension .smp in
UniPlot’s template directory.
To create new style order files copy one of the files. Use the file
Default.smp as a template. The file name should be short because space
in the toolbar field is limited.
If uniplot\template-directory is write protected you can save the new
files in the user directory or any other directory. To specify a new directory
choose Tools=>More Options. In this case copy the style order files from the
uniplot/template directory to the new directory.
The style order is displayed in the dataset style toolbar (see Toolbar=>Dataset Style).
If you would like to use this function in your automation scipt, see auto_AssignStyleOrder.
History
| Version | Description |
|---|---|
| 5.8.0 | Curve added. |
id-120657