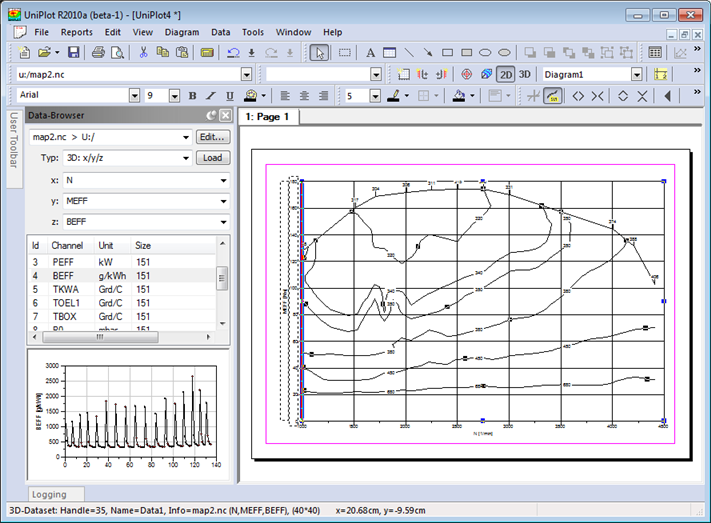
The Data Browser Window
The Data Browser is used to create datasets in the active document. To create a dataset with the Browser, drag a channel name from the list of channel names and drop it in a diagram.
Example:
- Choose File=>Import Data to import data into the Data Browser
- Set the dataset type in the the Type field, eg.
3D: x/y/z - Select the
xandychannel, for example N (speed) and MEFF (torque). - Drag the channel
BEFF(specific Fuel consumption) into the active page or the main window to create the map dataset.
See also File=>Import Data.
The z combo box can be used to search for a channel. Enter the first couple of characters of the name to find the channel and click on the name in the list. The selected channel name will be selected in the channel list box.
The data of a selected dataset cannot replaced with Drag & Drop. To replace the data click on the Load button.
If the Data Browser is not visible choose View=>Databrowser. If the Data Browser is disabled UniPlot will open the Data Editor. See also The Data Editor.
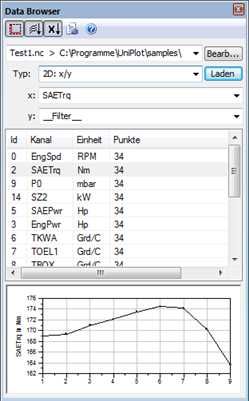
Data Preview
The Preview window displays the coordinates of the first selected channel versus the point index. The number of data points is limited to 100,000 data points.
Load Data into a Diagram
Choose File=>Import Data to open a data file. The channel names of the data file will be displayed in the Data Browser.
The Data Browser channel list displays the channel name, the Id (identical
with the varid used in the nc_* script functions), the channel unit and the
number of data points. The channel list can be sorted ascending or descending
by clicking on the column heading.
Multiple channels can be selected by holding down the Ctrl key. All selected channels can than be dragged into a document page.
For each selected channel a new dataset will be created. If the channel unit is different, a new diagram will be created for each channel.
Other import options like autoscale, x-sort etc. can be set in the popup menu of the Data Browser. To open the popup menu, right click anywhere in the Data Browser.
Drag & Drop
It depends on the mouse cursor position to which diagram a dataset is added when the left mouse key is released.
- A new diagram will be created if the mouse cursor is not over any diagram.
- If the mouse cursor is above a diagram without any datasets, the new dataset will be added to the selected diagram.
- The dataset will be added to the selected diagram if the diagram contains datasets with identical channel names or units. For stacked diagrams this will be checked for all axes. If no match is found, a new diagram (y-axis) will be added to the stacked diagram.
- If a new y-axis is added to a stacked diagram, it depends on the mouse position, if the axis is added to the left or right side of the stacked diagram.
- If the document holds dataset from different files, during the drag & drop operation, UniPlot will offer the possibility to plot the dragged dataset from all the files. A dialogbox will let the user which file to include.
Edit Data
The Edit button will open the active data file in the data editor. See also The Data Editor.