IoT applied to AirZone
Internet Of Thing (IoT) is the capacity of the electronic that surrounds us to interact and make our life easier.
The UniPlot use case presented below will give an extensive example of how to use UniPlot’s feature in this framework while navigating through.
 REST API
Note
The whole code and template for the use case is available in the sample
directory UniPlot\Samples\IoT
AirZone1.ic: the code
AirZone.ipz: the template
1. Why Controlling an A/C system with UniPlot
In this example there is a flat where the AirZone system is installed to allow the user to control how the Air Conditionning will heat-up or cool each individual room.
1.1 The system
A representation of this system is shown below. Each output of the conducts are equipped with an electrical motor controlled grid that is managed by the AirZone system based on the analysis of each room temperature.
The main machine blows air at a given temperature, and each grid will open or close itself to regulate the temperature of the rooms.
Indeed each room is equipped with a thermostat where a specific target temperature can be chosen for the room.
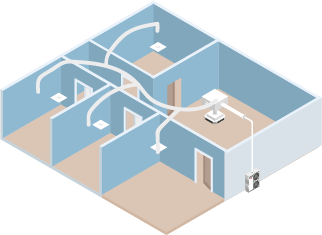
This system is meant to be working on its own but it does not provide any history of the system’s state over the time.
1.2 UniPlot and AirZone
AirZone provides the user with the possibility to interact with the system thanks to a RESTful API.
UniPlot can then interact with this API to:
Get data from it (temperature, set point, ON/OFF…) using the
POST method:
POST http://XXX.XXX.XXX.XX:3000/api/v1/hvac With the following body:
{
  "systemID": n (system number),
  "zoneID": m (zone number)
}
Send temperature set-points via an home-made user interface using the
PUT method:
PUT http://XXX.XXX.XXX.XX:3000/api/v1/hvac With the following body:
{
  "systemID": n (system number),
  "zoneID": m (zone number),
  "parameter" (parameter to modify, e.g "setpoint"): f (value)
}
As we can get data from the API, we will store it in an SQL database to be able to plot all the data over a period of time and do statistics and system analysis.
2. Discuss with the API: AirZone_curl_POST()
2.1 The cURL POST method
First things first, we need to contact the API to get some information.
UniPlot comes with the cURL library that will help us create our request.
// Initialize the request
curl = curl_easy_init();
o = [. cnt = 0, data = [.]];
// Preparing options
oOptions = [.
    URL =  "http://" + IPCASA + ":3000/api/v1/hvac",
    COPYPOSTFIELDS = "{\"systemID\":0,\"zoneID\":" + ltostr(key) + "}",
    HTTPHEADER = ["charset: utf-8"; "Accept: application/json"; "Content-Type: application/json"],
    WRITEFUNCTION = "_DownloadCBData",
    CURLOPT_WRITEDATA = o];
// Setting options
curl_easy_setopt(curl, oOptions);
// Send the request
r = curl_easy_perform(curl);
As one can see above, creating a request is done in 3 steps.
Initialize the request
curl = curl_easy_init();
Preparing the options
oOptions = [.
    URL =  "http://" + IPCASA + ":3000/api/v1/hvac",
    COPYPOSTFIELDS = "{\"systemID\":0,\"zoneID\":" + ltostr(key) + "}",
    HTTPHEADER = ["charset: utf-8"; "Accept: application/json"; "Content-Type: application/json"],
    WRITEFUNCTION = "_DownloadCBData",
    CURLOPT_WRITEDATA = o];
This is the trickiest part where all the important information goes. Each line is a flag that corresponds to a specific action in our request. Some of them will always be present and some will depend on what you need to achieve. All the flags are explained here: https://curl.se/libcurl/c/curl_easy_setopt.html
URL: the URL where the request is sent. It will always be presentCOPYPOSTFIELDS: This is the body needed in the request which holds the information of the system we want to know the status of.HTTPHEADER: It gives a description of what we send (here JSON encoded in utf-8).WRITEFUNCTION: It is a call back function used to store the answer received from the API.CURLOPT_WRITEDATA: It tells the previous callback function what to use to store the data ( here the object o).
Linking the options to the curl request:
curl_easy_setopt(curl, oOptions);
Executing the request:
r = curl_easy_perform(curl);
2.2 Receiving the answer
The following code will check whether an answer was received or not and then transform the information to use it in UniPlot
if (r != 0) {
    return curl_easy_strerror(r); // Return a possible error message
} else {
    bool = curl_easy_cleanup(curl); // Needed to close the curl
    s = "";
    if (o.cnt == 0) {
        return s;
    }
    for (i in 1:o.cnt) { // Unpack the data stored by the callback function
        s = s + mem_unpack(o.data[i]);
    }
    s_txt = utf8_decode(s);
    print(s_txt);
    svDataName = AirZonesvDataName(); // Vector of human readable room names.

    systemID[0].zoneID[key] = [.];
    // We store the information in a UniScript object
    for (ssName in svDataName) {
        s_txt_pos = strfind(s_txt, "\"" + ssName + "\"");
        if (s_txt_pos != 0) {
            s_txt_cut = strextract(s_txt, s_txt_pos + strlen("\"" + ssName + "\"") + 1);
            val = strtok(s_txt_cut, ",")[1];
            systemID[0].zoneID[key][ssName] = strtrim(strtok(s_txt_cut, ",")[1]);
        }
    }
}
The output of this function gives the following object to be used in UniPlot
[.
     = [.
        zoneID = [.
            [1] = [.
                air_demand = "0",
                coldStage = "1",
                coldStages = "1",
                errors = "[]",
                floor_demand = "0",
                heatStage = "1",
                heatStages = "1",
                humidity = "65",
                maxTemp = "27",
                minTemp = "15",
                mode = "3",
                name = "\"Salon\"",
                on = "0",
                roomTemp = "21.600000381469727",
                setpoint = "22.5",
                systemID = "1",
                units = "0",
                zoneID = "1",
            ],
            [2] = [.
                air_demand = "0",
                coldStage = "1",
                coldStages = "1",
                errors = "[]",
                floor_demand = "0",
                heatStage = "1",
                heatStages = "1",
                humidity = "74",
                maxTemp = "27",
                minTemp = "15",
                mode = "3",
                name = "\"Hab.Matrimo\"",
                on = "0",
                roomTemp = "21",
                setpoint = "18",
                systemID = "1",
                units = "0",
                zoneID = "2",
            ],
3. Store the data: AirZone_DB()
Now that we can contact the API and get the information of our system, let’s store it in an sql database to decide later on what to do with it.
We start by creating the database
db = sqlite3_open(ssSrcDir + "/AirZone.db");
We then create the tables needed if they do not exist
for (zone in zones) {
    sqlite3_execute(db, "create table if not exists " + zone ...
        + "(" + svValName[1] + " varchar(100), " ...
        + svValName[2] + " varchar(100), " ...
        + svValName[3] + " varchar(100), " ...
        + svValName[4] + " varchar(100), " ...
        + svValName[5] + " varchar(100));");
}
    b = sqlite3_execute(db, "create table if not exists TimeStamp(" ...
        + "TimeStamp varchar(100), " ...
        + "Year varchar(100), " ...
        + "Month varchar(100), "...
        + "Day varchar(100), ...
        + "YearMonthDay varchar(100));");
}
In this example we create 1 table per room and each table will hold 5 information:
TimeStamp
Room Temperature
Room Temperature Setpoint
Room Regulation state (ON/OFF)
Room Air Demande (blowing or not)
Next to these tables we create another one to store date information under different form:
TimeStamp
Year
Month
Day
YearMonthDay
Then we call the function created earlier to get a set of fresh data
and also inquire the actual time stamp
Temperatures = AirZone_curl_POST();
t = DT_GetCurrentTime();
Next step is to store the information in the tables
for (zone in 1:len(zones)) {
    obj = Temperatures[0].zoneID[zone];
    sqlite3_execute(db, "insert into " + zones[zone] + " values("+ sprintf("%.4f", t) + "," ...
                                        + obj.roomTemp + "," ...
                                        + obj.setpoint + "," ...
                                        + obj.on + "," ...
                                        + obj.air_demand+ ");");
}
And for the time stamps
ssYear = DT_Format(t, "20%y");
ssMonth = DT_Format(t, "%m");
ssDay = DT_Format(t, "%d");
ssYearMonthDay = "'" + DT_Format(t, "20%y.%m.%d") + "'";
request = "insert into TimeStamp values("+ sprintf("%.4f", t) + "," + ssYear + "," + ssMonth + "," + ssDay + "," + ssYearMonthDay + ");";
sqlite3_execute(db, request);
Finally we close properly the database
db = sqlite3_close(db);
3. Let UniPlot work: AirZone_DB_service_ON()
We have created a structure able to call a REST API using curl library, fetch some information on our system and store it in a database.
We now want to gather data for a given period to be able to analyze how our system works.
To do so UniPlot can create a kind of service called Timer.
The function AirZone_DB_service_ON() is in charge of creating this timer
for us
def AirZone_DB_service_ON() {
    _g().AirZone = [.];
    _g().AirZone["Timer"] = AppNewTimer("AirZone_DB", AirZone_dtUpdate * 1000);
    log_warning("uniscript", "AirZone", "AirZone Service ON (Refresh rate: " + ltostr(AirZone_dtUpdate) + "s)");
}
We use the global object _g() to store a dedicated object AirZone to
which we assign the identifier of the timer
_g().AirZone["Timer"] = AppNewTimer("AirZone_DB", AirZone_dtUpdate * 1000);
When this function is executed, the function AirZoneDB will be called every
AirZone_dtUpdate seconds.
To Stop it we also created the following function which kills the timer by getting its identifier thank to the object created earlier
def AirZone_DB_service_OFF() {
    AppKillTimer(_g().AirZone["Timer"]);
    log_warning("uniscript", "AirZone", "AirZone Service OFF");
}
4. Time to use the data
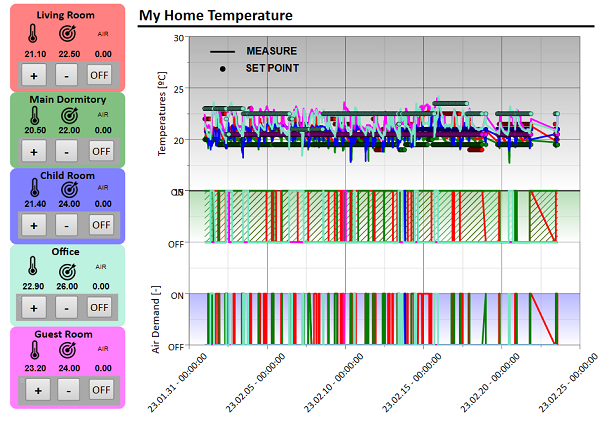
Now that we have setup our database and that it stores at a given frequency the state of the AC controller and the flat temperature, we want to make good use of this data and plot it.
In the following sections we will see a possible way to plot the data into an existing template via a small interface and how to use UniPlot features to live update the diagrams.
4.1 Plot it: AirZone_FetchAndPlot(bWatch, DateMin, DateMax)
This function will accept 3 parameters:
bWatch: Use for continuous plotting. We will come back to it later on.
DateMin, DateMax: It is the range of data we want to plot.
The data will be plotted in the following template.
To start we must open a template prepared to receive the data
// Open the template
if (bWatch == 0) {
    ssName = strcat(SplitPath(source(stack(0))), "");
    ssSrcDir = sum(SplitPath(ssName)[1, 2]);
    hPage = auto_LoadTemplate(ssSrcDir+"\\AirZone.ipz");
    _g().Airzone = [. "ssSrcDir" = ssSrcDir, ...
        "hPage" = hPage];
    print(_g().Airzone);
} else {
    ssSrcDir = _g().Airzone["ssSrcDir"];
    hPage = _g().Airzone["hPage"];
}
Then we gather the dataset handles to be updated and store it into an
object to make the interaction easier. Each dataset has a name in the template.
So we store the dataset handle in a key that has the dataset name.
// Prepare data replacement
//hvPage = DocGetAllPages(hDoc, FALSE, FALSE);
hvData = PageGetAllDatasets(hPage);
o_Assignment = [.]
for (i in 1:len(hvData)) {
    o_Assignment[ObjGetName(hvData[i])] = hvData[i];
}
Time to interrogate the database to fetch the data.
Request creation We create the correct requests for each zone using SQL syntax
"SELECT TimeStamp.TimeStamp, RoomTemp, SetPoint, AcOn, AirDemande "... // We select the columns to extract
    + "FROM TimeStamp "... // In the main TimeStamp table
    + "INNER JOIN " + zone + " " ... // Making an inner join with the table corresponding to the zone we analyze
    + "ON TimeStamp.TimeStamp = " + zone + ".TimeStamp " ... // using TimeStamp as index
    + " WHERE TimeStamp.YearMonthDay >= " + DateMin + " AND TimeStamp.YearMonthDay <= " + DateMax ... // only within the requested time frame
    + ";";
The code looks like this
ssName = strcat(SplitPath(source( stack(0))), "");
db = sqlite3_open(ssSrcDir + "/AirZone.db");

o = [.];
for (zone in zones) {
    if (bWatch == 0) {
        request = "SELECT TimeStamp.TimeStamp, RoomTemp, SetPoint, AcOn, AirDemande "...
                                        + "FROM TimeStamp "...
                                        + "INNER JOIN " + zone + " " ...
                                        + "ON TimeStamp.TimeStamp = " + zone + ".TimeStamp " ...
                                        + " WHERE TimeStamp.YearMonthDay >= " + DateMin + " AND TimeStamp.YearMonthDay <= " + DateMax ...
                                        + ";";
    } else {
        request = "SELECT TimeStamp.TimeStamp, RoomTemp, SetPoint, AcOn, AirDemande "...
                                        + "FROM TimeStamp "...
                                        + "INNER JOIN " + zone + " " ...
                                        + "ON TimeStamp.TimeStamp = " + zone + ".TimeStamp " ...
                                        + "WHERE TimeStamp.TimeStamp=(SELECT max(TimeStamp.TimeStamp) FROM TimeStamp);";
    }
}
Request execution We ask UniPlot to execute the request and store the output
in smTimeStamps
smTimeStamps = sqlite3_execute(db, request);
Replacing the data That data has to be assigned to its dataset.
As shown below, each dataset has been given a name which is the concatenation of the zone name (office, bedroom etc…) and the variable (Temperature, Set-point, …).
The code will create an object whose keys are the name of the dataset and the values the handles
for (idx in 2:len(svValName)) {
    hData = o_Assignment[zone + "_" + svValName[idx]];
    rvX = strtod(smTimeStamps[;1]);
    rvY = strtod(smTimeStamps[;idx]);
    if (bWatch == 1) {
        rmXY = XYGetData(hData);
        rvX = [rmXY[;1];rvX];
        rvY = [rmXY[;2];rvY];
    }
    bool = XYSetData(hData, rvX, rvY);
}
Closing the database
bool = sqlite3_close(db);
Updating the template
PageReplot(hPage);
log_info("uniscript", "AirZone", "AirZone Plot update");
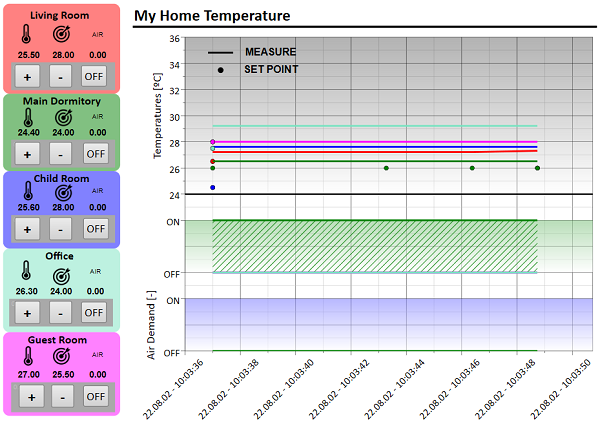
After all these efforts we should get the following output.
4.2 Let’s make it user friendly: AirZone_Interface()
The AirZone_FetchAndPlot(bWatch, DateMin, DateMax) function mentionned in the
previous chapter would benefit being called by an interface where the user can
select start and end dates to be plotted. This is what the AirZone_Interface()
function is about.
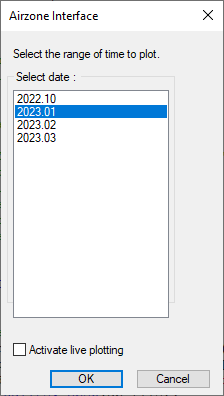
The interface creation is built using the following philosophy. As one can see,
it displays the months where data is available. To do so we need to interrogate
the database get this information. The we format it properly and create the
dialog template. Then the dialog is launched, the user select the period he wants
to analyze. With this information, the AirZone_FetchAndPlot function is called.
Let’s retrieve the database and store its identifier in db
// Database
// Opening and creation if needed
ssName = strcat(SplitPath(source( stack(0))), "");
ssSrcDir = sum(SplitPath(ssName)[1, 2]);
db_file = ssSrcDir + "AirZone.db";
db = sqlite3_open(db_file);
We then execute an SQL call onto db to retrieve all the time stamp
information and close the database.
smTimeStamps = sqlite3_execute(db, "select * from TimeStamp;");
bool = sqlite3_close(db);
A bit of formating of the smTimeStamps string matrix lead us to
have a usable ListBoxText usable in the init string
of the dialog box.
svYearMonth = ST_set(DT_Format(strtod(smTimeStamps[;1]), "20%y.%m"));
svYearMonth_List = CreateListBoxText(svYearMonth, 2);
svYearMonthDay = ST_set(DT_Format(strtod(smTimeStamps[;1]), "%x"));
svYearMonthDay_List = CreateListBoxText(svYearMonthDay, svYearMonthDay[1]);
To create our dialog box we will now prepare the init string and the
template. If you have a doubt on how it works you can read the
DialogBox documentation.
// Initialization string
svInitString = ["Select date: ", svYearMonth_List, "0"]; //svYearMonthDay_List, "0"]
// Creation of template
svTemplate = ["Select the range of time to plot.", ...
                "|G10                        |", ...
                "|M10                          |", ...
                strempty(1, 10), ...
                "|BActivate live plotting|"];
The dialog box ready, we launch it using the DialogBox function
and store the output in DateMin and DateMax. Also notice the
bContinuousPlot variable, I will mention it later on.
// Launch DialogBox
svOutput = DialogBox(svTemplate, svInitString, "Airzone Interface");
if (svOutput[1] == "DLG_CANCEL") {
    return 0;
}
<svList, svSel> = GetListBoxText(svOutput[2]);
DateMin = "'" + svList[1] + ".01'";
DateMax = "'" + svList[len(svList)] + ".31'";
bContinousPlot = strtol(svOutput[3]);
Time to finally call our FetchAndPlot function. And the template will be
populated with the desired data.
AirZone_FetchAndPlot(0, DateMin, DateMax);
4.3 Continuous Plotting: FileWatchAdd()
We now have two sources of data to analyze.
Direct reading from the API
Our SQL database with our recordings
To do so we created a simple interface which aim is to show the user the data
available and to plot it as seen in the previous chapter. In this earlier part I
mentionned the bContinuousPlot which the user can set to 1 by clicking on
the related checkbox. This check box will enable an automatic update of the
template when new data is available.
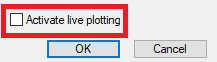
If set to 1, in the AirZone_Interface() the FileWatchAdd function is
called along with the callback function AirZone_FetchAndPlot_WATCH().
// Setting up continous plotting
if (bContinousPlot) {
    bool = FileWatchAdd(db_file, "AirZone_FetchAndPlot_WATCH", 1);
}
The aim here is to tell UniPlot to check whenever the database is modified (so a
new set of data has been stored) and to call the function
AirZone_FetchAndPlot_WATCH. Which in its turn will call AirZone_FetchAndPlot
whith the boolean bWatch set at 1.
def AirZone_FetchAndPlot_WATCH(rsFile, bWatch) {
    // This function has been created to support the FileWatch which has only 1 argument
    AirZone_FetchAndPlot(bWatch);
}
We saw earlier that the bWatch variable changes the code behavior. As here we
want to activate a continuous plotting, this variable has 2 effects :
It retrieves the template actually in use which is stored in
_g().Airzoneto start updating it instead of creating a new one.
ssSrcDir = _g().Airzone["ssSrcDir"];
hPage = _g().Airzone["hPage"];
If modifies the SQL request to retrieve all the data available up to the actual time.
request = "SELECT TimeStamp.TimeStamp, RoomTemp, SetPoint, AcOn, AirDemande "...
                               + "FROM TimeStamp "...
                               + "INNER JOIN " + zone + " " ...
                               + "ON TimeStamp.TimeStamp = " + zone + ".TimeStamp " ...
                               + "WHERE TimeStamp.TimeStamp=(SELECT max(TimeStamp.TimeStamp) FROM TimeStamp);"
The rest of the function is used as previously to plot the updated graph.
5. Control the A/C AirZone system with UniPlot
I mentionned in the UniPlot and AirZone chapter that the API offers two methods.
POST to read info from the system
PUT to send control request to the system.
Thanks to this I will now empower my template with controls (buttons) that can switch ON and OFF my A/C and even set the desired temperature!
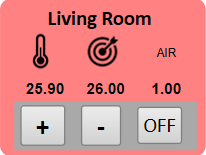
To do so, each button of my template will be assigned a callback function and specific parameters depending on the need.
5.1 Adding the callback to our button
To add a callback function to a textbox, one has to right-click on it and select Properties in the context menu. Then go to the Properties tab. In this tab:
Check Display as a button
Check
OnClick-Callback-NameAdd a callback function name as follows
FunctioName?Param1,Param2,Param3
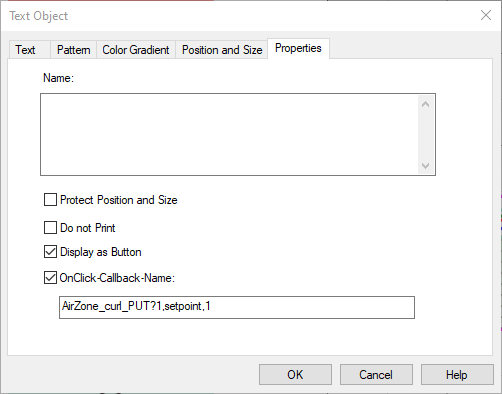
AirZone_curl_PUT?1,setpoint,1
The string placed in the callback function name will be parsed in the function afterward.
5.2 The callback function AirZone_curl_PUT()
- bool = AirZone_curl_PUT(_zoneID, _action, _val)
Return Value
bool is TRUE (1) if no error happened during the process.
The function receives 3 arguments
Parameters
- _zoneID
_zoneID is the zone we want to act on.
- _action
_action is the action that will be executed.
- _val
_val is the value is for the action. For example the temperature setpoint.
The parameters can come from the UniScript call where they are explicitely given, or from the Callback function name as explained earlier.
Parse the arguments
hTB is the handle of the textbox and with this parameter and the function
ObjectGetCallbackFunctionName we get the name of the callback function
that we parse using the strtok function. We then store only the parameters
as a vector in sv.
hTB = _g()._handle();
ssFuncName = ObjectGetCallbackFunctionName(hTB, "ObjectClickCallback");
sv = strtok(ssFuncName, "?");
    // sv = FunctioName?Param1,Param2,Param3
    // sv[1] --> function names
    // sv[2] --> coma separated arguments
if (len(sv) == 2) {
    sv = strtok(sv[2], ", ");
} else {
    log_warning("uniscript", "Check parameter input for AirZone request -> function?zoneID,action,val");
    return 0;
}
Store the arguments
If the function is called without arguments we use what was coming from the
sv variable, otherwise we use the arguments.
if (nargsin() == 0) { // Sub Call
    if (len(sv) == 3) {
        zoneID = sv[1];
        action = sv[2];
        val = sv[3];
    } else {
    log_warning("uniscript", "Check parameter input for AirZone request -> ?zoneID,action,val");
    return 0;
    }
} else if (nargsin() == 3) {
        zoneID = _zoneID;
        action = _action;
        val = _val;
}
Setpoint preparation
If the user clicked the + or - action from our control, we need to know the
actual temperature setpoint to add or remove a degree from it and later on send
it to the A/C system. We also use the occasion to switch on the zone sending
AirZone_curl_PUT(zoneID, "on", "1").
// Request preparation if action is temperature setpoint
if (action == "setpoint") {
    setpoint = strtod(AirZone_curl_POST(strtol(zoneID), "setpoint"));
    if (val == "1") val = setpoint + 1 else val = setpoint - 1;
    val = ltostr(val);
    AirZone_curl_PUT(zoneID, "on", "1")
}
Sending the request
The following code will send the PUT request to the system with the correct zone, action and value to the system.
// Curl request creation
curl = curl_easy_init();
data = "{\"systemID\":0,\"zoneID\":4}"
o = [. cnt = 0, data = [.]];
// Preparing options
oOptions = [.
    URL =  "http://"+IPCASA+":3000/api/v1/hvac",
    CUSTOMREQUEST = "PUT",
    COPYPOSTFIELDS = "{\"systemID\":0,\"zoneID\":"+zoneID+",\"" + action + "\":" + val + "}",
    HTTPHEADER = ["charset: utf-8";"Accept: application/json";"Content-Type: application/json"]];
// Setting options
curl_easy_setopt(curl, oOptions);
r = curl_easy_perform(curl);
//curl_easy_setopt(curl, CURLOPT_CUSTOMREQUEST, NULL) // To avoid further requests to be set as PUT
if (r != 0) {
    return curl_easy_strerror(r);
} else {
    bool = curl_easy_cleanup(curl);
    // Setting up format
    __FF_FieldUpdate(0, 0, 0, 0, FFU_ONDATACHANGE);
    b=PageReplot(GetParent(GetParent(hTB)));
    return 1;
}
5.3 Airzone field function
To close the loop, if you open the template AirZone.ipz and check one of the text field to display the temperature and its setpoint that I use a field function that uses everything we created up to know to display a numeric information on the state of our system.
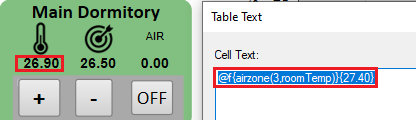
The field function uses AirZone_curl_POST as defined previously and will be
called everytime the page is refreshed.
def __ff_airzone(hDoc, hPage, hLayer, hText, nAction, svParameter)
{
    // Argument parsing
    if (len(svParameter) == 2) {
        zoneID = strtol(svParameter[1]);
        action = svParameter[2];
    } else {
        log_warning("uniscript", "Check parameter input for AirZone request -> ?zoneID,action");
        return "??";
    }
    info = AirZone_curl_POST(zoneID, action);
    return info;
}
Conclusion
This use case covered a wide range of UniPlot functionality so that you can apply them to your own projects. We saw that UniPlot can be your new interface to your IoT at home, but also to monitor and control installations at your work place and it will of course give you all the tools you need to get insight on the data created.
id-1870160