plateau_computation
plateau_computation computes a statistic for each plateau defined by rvPlateau using the corresponding values from rvData.
A variety of statistical operations can be applied independently to each detected plateau (e.g. mean, minimum, maximum, standard deviation).
- rmXY = plateau_computation(rvPlateau, rvData, rsOperation, bTable);
Return Value
rmXY is a vector whose content depends on bTable. With bTable = 0, the computed statistic is assigned to all samples of each plateau (all other samples are set to #INF), whereas with bTable = 1, a single value per plateau is returned, suitable for tabular representation or further processing.
Parameters
- rvPlateau
rvPlateau is the channel displaying the plateaus.
- rvData
rvData is the channel for which the statistic is going to be computed.
- rsOperation
Is the statistic to compute on rvData for each plateau in rvPlateau
rsOperation
Meaning
mean
Mean Value
max
Max Value
min
Min Value
start
Start of the plateau (X axis)
end
End of the plateau (X axis)
end-start
Duration of the plateau
maxcumsum
Maximum of Cumulated Sum of Y over the plateau
meandeviation
Mean absolute deviation from the mean.
variance
Variance
standarddeviation
Standard Deviation.
standarddeviation2
Twice the Standard Deviation.
median
Median
npoints
Number of points on the plateau.
- bTable
bTable states whether the data is provided :
as a vector of the same lenght of the original data, but 0 out of the steps and the results of the computation on each plateau.
as a vector with as many points as steps, useful to be represented as a table in a report.
Example
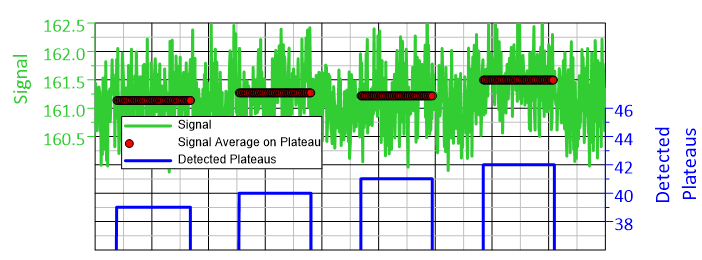
In the example below, the signal rvData (green) is average on each plateau (blue).
History
Version |
Description |
|---|---|
R2026.3 |
New. |
See also
Overview Mathematic, Data=>Plateaus Computation, Data=>Find Plateaus, find_plateau, Filter Functions for XY datasets
id-707603