Peaks, Events & Limit Checks
Long test recordings hide the few moments that matter: a speed above the
limit, a temperature that stayed too high for too long, the steady-state
phases of a step test. UniPlot finds them with filter functions such as
find(), event_duration() and peaks() and with the commands
Find Peaks… and Find Plateaus… of Data=>More Data Functions….
The results are curves, markers or tables that are updated automatically for
every new measurement file.
Guides
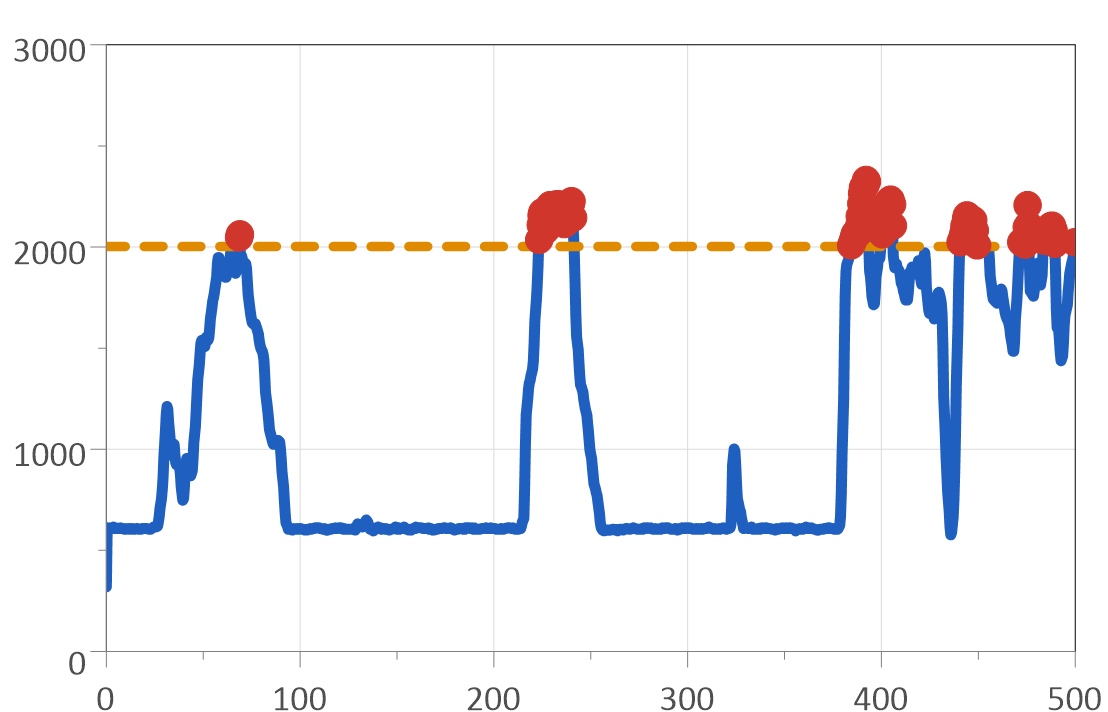
Mark every point above or below a limit with find().
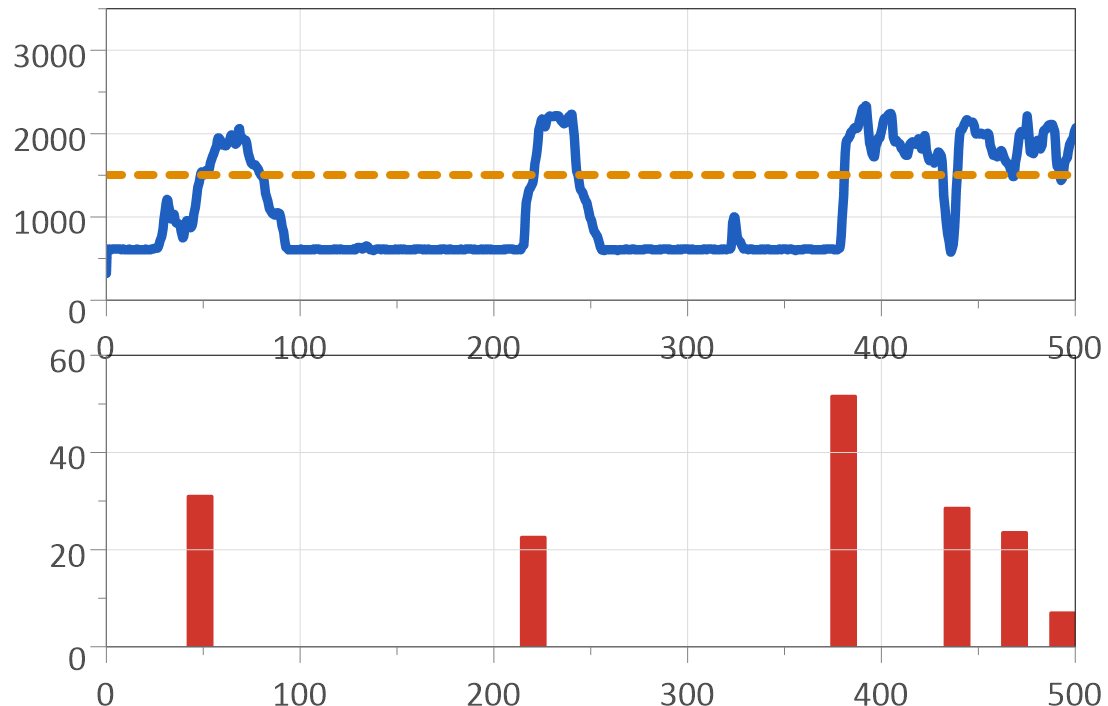
Measure how long a signal stays above a limit.

Find the steady-state phases of a test.

Evaluate the load steps of a fuel cell test.
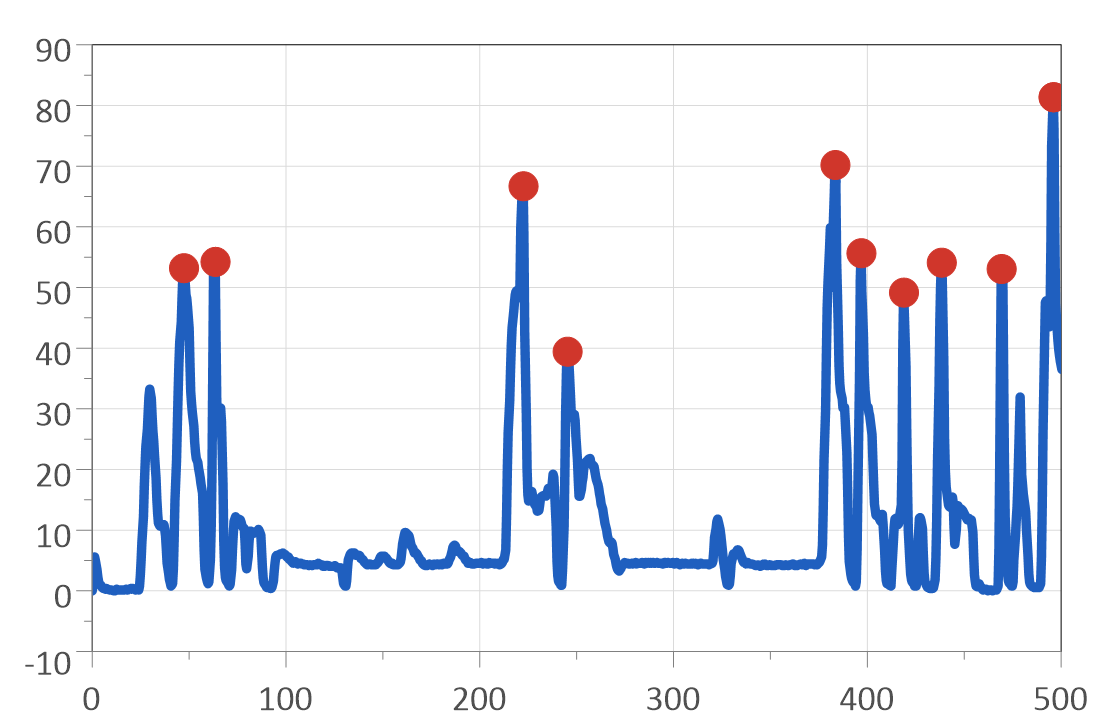
Find local maxima and minima automatically.
Quick answers
How do I count how often a signal crosses a threshold?
Use the formula function crossings(rvData, rsThreshold) of the Formula
Interpreter. It returns 1 where the signal crosses the threshold and 0
elsewhere, so the sum is the number of crossings:
nCross = sum(crossings(Alpha, 90)). See
Formula Interpreter 1 - Introduction. See also How can I detect a threshold crossing (for example a voltage drop) automatically?.
How do I get a table with the start time of every event?
Apply find(min, max, 2, 3);event_duration() to a copy of the curve. The
result has one point per event: x is the start, y the duration. Right-click
it and choose Text Object=>2D-Table. See
How do I measure how long a signal stays above a limit?.
How do I get the number of events and the longest and mean duration?
The result of event_duration() is a normal curve with one point per
event, so its number of points is the number of events. The field function
@f{xystatistic(DatasetName)} in a text object shows its minimum,
maximum, mean and standard deviation, here the shortest, longest and mean
event duration.
How do I get the total time a signal spent above a limit?
Use find(limit, 99999, 2, 3);integrate(). find turns the signal into
1 above the limit and 0 below, the integral of that grows by the time spent
above the limit. The last value of the curve is the total time.
How do I label the peaks of a curve with their values?
Select the curve, choose Data=>More Data Functions… > Find Peaks… (or right-click the curve > New Dataset > Find Peaks…) and enable Label Points: UniPlot creates a new curve with the local maxima, minima or both, shown as markers with their values (by default up to 50 labels). In scripts, auto_xy_Peaks does the same. The peak curve is updated when the source curve gets new data. See also Why does a 2D: x/y/Label dataset not show all my remarks?.
How do I find only the maxima, or only the minima?
peaks(Threshold, bAbsolut, Type) and the command Find Peaks…
(Data=>More Data Functions…) have a Type: 1 finds local maxima,
2 local minima and 3 both. Only extremes that differ from their neighbors by
more than the threshold are found.
How do I compare the peaks or overshoots of several test runs?
Load the same channel from every run into one diagram, see
How do I compare the same channel from several measurement files?. Then give each curve
the same filter, for example peaks(10, 0, 1) or
find(2000, 99999, 2, 0). In a script, XYSetFilterFunctions
sets it for all curves in a loop. The number of points of each filtered
curve is the number of peaks or violations of that run.
How do I check that a signal stays inside a tolerance band?
Draw the band as a threshold range: right-click in the diagram, choose
Threshold Value… and set a range. Then mark the violations on two
copies of the curve with find(upper, 99999, 2, 0) and
find(-99999, lower, 2, 0). If a copy shows a single point with the
value 0, nothing was found. With find(upper, 99999, 2, 3);event_duration()
you also get the duration of each excursion. See also
Why does the min/max of a threshold range jump to wrong values?.
How do I check the deviation from a setpoint?
Calculate a new channel with the Formula Interpreter, for example
Deviation = abs(Actual - Setpoint), and apply
find(tolerance, 99999, 2, 0) to it. The remaining points are all the
moments where the deviation was larger than the tolerance. See
How do I calculate a new channel, for example power, from measured channels?.
How do I make limit violations visible in a long recording?
Copy the curve and give the copy the filter find(limit, 99999, 2, 0),
shown with markers only. Every point above the limit is then marked on the
original curve. Add a threshold line (right-click in the diagram,
Threshold Value…) for the limit itself. See
How do I find the points where a signal overshoots or undershoots a limit?.
How do I show pass/fail results in color?
Put the results in a table and add conditional formatting: select the cells, right-click and choose Conditional Formatting=>Add Rule…. A rule compares the cell value (greater, less, between, not between, …) or evaluates a formula and sets the text and fill color. The rule is stored in the template, so every new file is colored the same way. See How do I highlight values outside the specification in a report table?. See also How do I highlight a table cell automatically when a value exceeds a limit, or show a number in exponential notation?.
Support questions
Error messages, settings and other practical problems in this area are answered in the FAQ: Formulas, Filters and Calculations and Diagrams, Axes and 3D Maps.
id-62432