File=>Import Data
Loads 1D (t/y dataset), 2D and 3D datasets into the selected diagram.
UniPlot can import data from Text-(ASCII-Format), Excel (BIFF Format), NC (netCDF) files and other formats. See Importing Data for a list of supported file formats.
The function is written in UniScript and can be altered to suit your specific needs.
The data must be arranged in columns. Each data column should be complete. The import function will ignore date or text columns. The column separator and the decimal separator can be set in the Import Options dialog box.
To import data, do the following:
Check the setting in the File=>Import Options dialog box.
Choose File=>Import Data. You can choose one or more ASCII-, Excel or netCDF files from the dialog box. First choose the drive, directory and file type. By dragging the mouse in the list of file names, more than one name can be selected. By holding down the Ctrl key, single files can be selected or unselected. By pressing the Shift key, ranges of files can be selected.
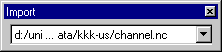
Click OK. The selected files will be converted and shown in the Import dialog box. The file name will also be inserted to the combo box in the toolbar.
To open an already converted file select the file from the combo box in the toolbar. If more than one file is imported at the same time, then the last imported file is shown in the Import dialog box. To open another imported file, choose the file name from the combo box.
Data can be loaded to a diagram in various ways with the help of the Import dialog box:
If no diagram has been chosen, a new diagram will be produced when Load is clicked.
If you have opened a document with more than one diagram, the dataset will be inserted into the selected diagram:
If no dataset is selected in the diagram, the style of the new dataset will be taken from the dataset style displayed in the toolbar.
If a dataset is selected, a message box with the question
Replace Dataset?will appear. Choose YES, if you want to replace the data of the selected dataset. Choose NO if you want to load the data into a new dataset. In both cases, the dataset style of the selected dataset will be used to plot the new dataset.
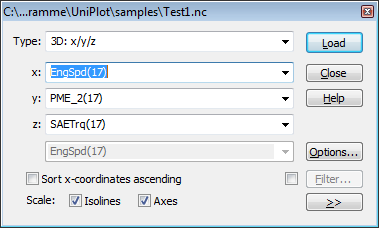
- Type
The list box shows all Load filters. The following filters are available:
1D: y/t: The points in a 1D dataset are measured equidistantly (i.e. time signals or crank shaft related signals). The x-value of the first data point and the distance between two points is set in the 1D and 2D Dataset dialog box.
2D: x/y: The data points in a 2D dataset are formed by x/y pairs. The points are added to the dataset in the same order as they are listed in the data file. At least 2 data points are necessary to create a 2D dataset.
2D: x/y Bit: See Data=>2D Bit Dataset.
2D: x/y Errorbars: The data for error bars can be loaded from channels. To do this, choose “2D: x/y Errorbars” in the Data Browser. A channel for the positive error and a channel for the negative error must be selected.
2D: x/y/Label: For this type the data points will be labeled with the values of a third channel. The third channel can be a text channel, a date channel or a real channel (number).
2D-Cycle: For this type the data will be split into cycles. For each cycle a separate dataset will be created. If the x-data is increasing for all data points a dialog box will be displayed, to specify the cycle start and cycle length. Example for crank angle data: Start=0 CA, Length=720 CA.
If the data for the x-coordinates is already in the form 0,1,2…718,719,0,1,2, …, a new dataset starts at the first point that is smaller as the point before (719 to 0).
2D: x/y/Cycle-Index: Cycle-Index is a channel that has a unique integer for each cycle, starting with 1. For each value one dataset will be created.
Example:
CAl pCyl1 Cycle 0.0 2.8 1 0.2 2.91 1 0.4 2.94 1 … … … 720.0 2.6 1 0.0 2.76 2 0.2 2.81 2 … … … 2D: y/t “MDF/INCA-Data”: This option is for MDF data files (e.g. INCA) For this option the selected data channel will be plotted versus time. The correct time channel will be selected automatically. To simplify the channel selection the option
Remove Group Namein theTools=>MDF Configuration (INCA)dialog box (see Import of MDF Files) should be checked.If a channel in the NC file contains the attribut
_nc_enum, the value will be used as labels for the y axis.
2D: pV-diagram: (CA) Crank Angle is used to split cycles: This type is used to create a p-V plot (pressure volume diagram: x = volume, y = pressure). The crank angle channel is used to split the cycles in a number of datasets with a single cycle.
3D Dataset: Data points of a 3D dataset which are formed by a x/y/z triple can be irregularly distributed in the x/y plane. To create a 3D dataset, at least 5 data points are necessary. The data points must span a surface above the x/y plane, and each point in the plane can have only one z-value.
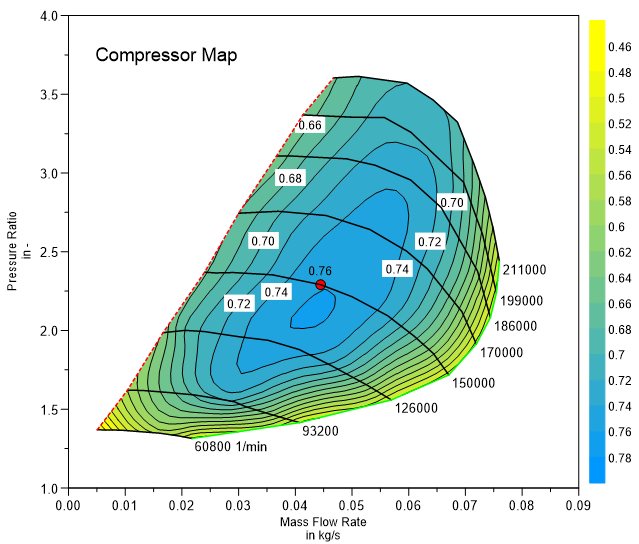
3D: Compressor-Map x/y/z/speed: 4 channels must be specified for a compressor map e.g. x = air flow, y = pressure ratio, z = efficiency, speed = wheel rotation speed. The coordinates of the x/y/z channels are used to create the efficiency map. The speed channel is used to sort the x/y data and create curves of constant speed. The curve are labeled with the rounded speed value. The curves are used to find the surge limit and pump limit.
Replace File: For this type a dataset must be selected in the page. The function searches for all datasets loaded from the same data file as the selected dataset and replaces the data.
Add File: For this type a dataset must be selected in the page. The function searches for all datasets loaded from the same data file as the selected dataset. The function creates copies of the datasets with the data from the new data file. A dialog box will be displayed the select the curve style.
Text: Data Table:
For this type a data table is created for the selected channels. A double click on the table opens the configuration dialog box. See Browser=>Create Embedded Data Table.
Text: Create Channel info Table:
This option will allow you to create a table with all the functions available for data placeholder. When you click on load, a table with the selected channel is displayed. On each line appears a channel for which you can select some functions to be displayed using the combo-box.
Text: Create Header Table:
With the help of this option a header table can be created. See Browser=>Create Header Table. If you would like to display the table of multiple pages of the same document, copy the table into the other pages. Make sure that no cells in the table are selected, press Ctrl+C and paste the table with Ctrl+V into the other pages. Open the dialog box Diagram=>More Diagram Functions=>Global Placeholders to select the placeholders that should display the same text on all pages. To edit the text double click in the table.
Text: Load Placeholder Text:
This function replaces all placeholders in the page with attribute values from the selected data file (see Text Placeholder).
- X, Y, Z
- The combination boxes show the names of the file’s data columns. The number in parentheses shows the number of data points of the variables. According to dataset type (1D, 2D, 3D), a variable will be assigned for X, Y and Z. If the ASCII- or Excel file does not have a column title, the columns will be assigned default names Col1, Col2 etc.
- Scale Isolines
- If this box is checked, isolines will be created automatically for a 3D dataset.
- Scale Axes
- If this check box is selected, the diagram axes will be scaled automatically.
- Load
- This button loads a dataset to the selected diagram. If a diagram has not been selected, a new diagram will be created and added to the active page. If an active diagram document is not available, a new document will be produced. The diagram axes will be scaled through Import when the options box has been chosen.
- Close
- This button closes the Import dialog box.
- >> Button
- The button enlarges or reduces the dialog box so that other dialog box elements can be shown or hidden.
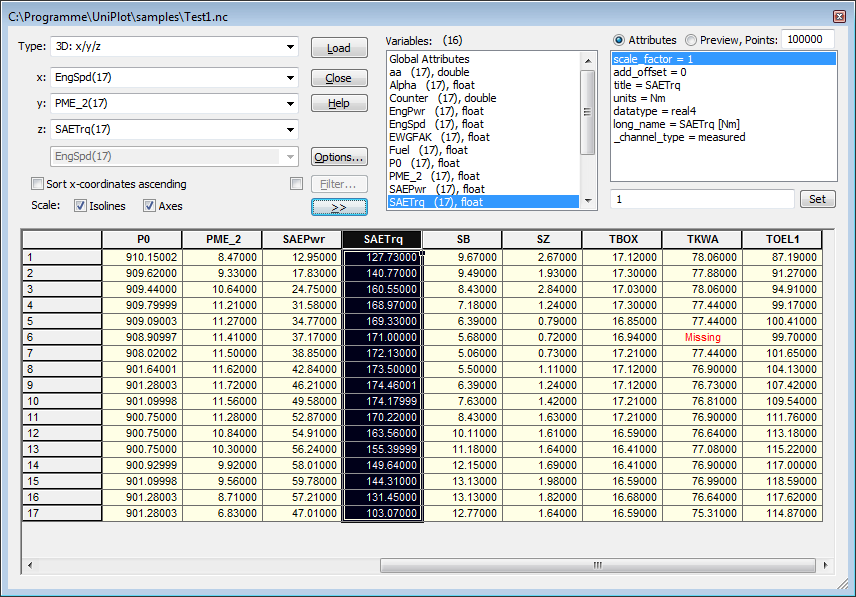
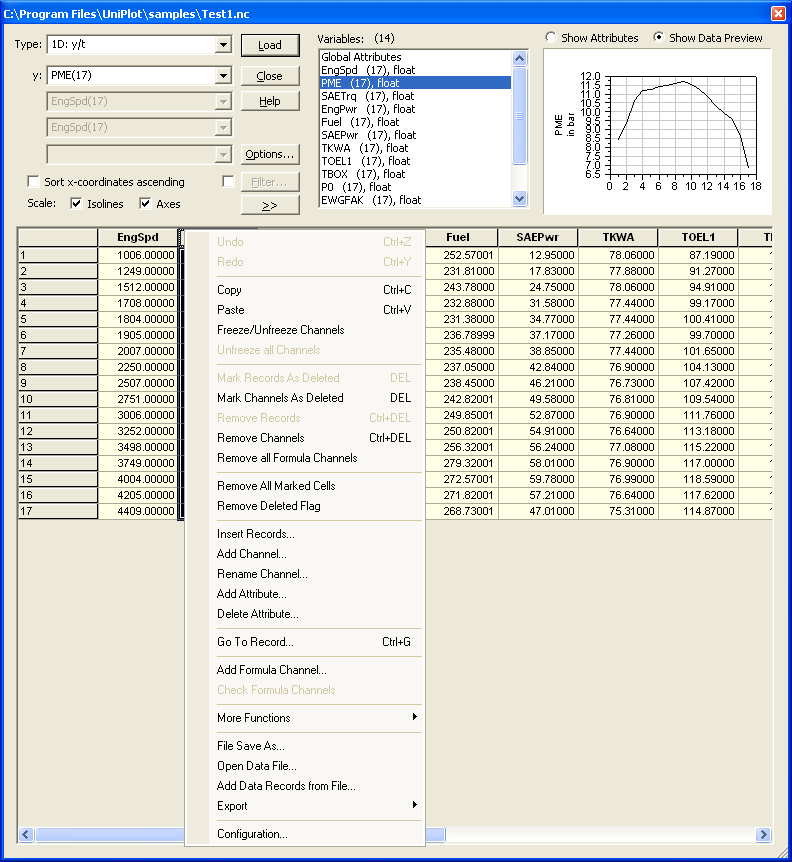
- Data Grid
The grid displays the data in table form. All variables displayed in the data grid have the same number of data points. If the file contains variables with different number of data points select one of the variables from the Variables list box.
The data in the list can be edited.
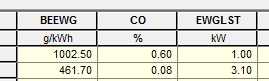
The data editor displays the unit string in the row below the channel names:
The unit string can be disabled with the command:
WriteProfileString("GRID_OPTIONS", "ExtraTitle", "_none_");
The following command displays the data for the “units” channel attribute:
WriteProfileString("GRID_OPTIONS", "ExtraTitle", "units");
or a different channel attribute, e.g. “title”.
- Variables
- The list shows the file’s variables (channel names). The number of data points is displayed in round brackets after the variable name. The variable data type follows behind the number of data points. (For example: double (8 bytes) or float (4 bytes)).
- Attributes
- This list shows the attributes of the selected variable. To edit an attribute, select it with the mouse. The value can be edited in the text box underneath. Choose the Set button to copy the change to the file.
Commands in the shortcut menu.
To display the shortcut menu, right-click on the data grid:
The commands in the shortcut menu are described in the article The Data Editor.
The Import command is written in UniScript. The source code is
found in the files do_impor.ic and do_fconv.ic
The source code of the functions in the short cut menu are located in
the mn_grid.ic and netcdf.ic files.
See also
id-1734369