File=>File Quick View
Loads all data of a file as curves or maps into diagrams.
To execute the Quick View function:
Choose File=>File Quick View.
Select one or more data files in the dialog box that appears.
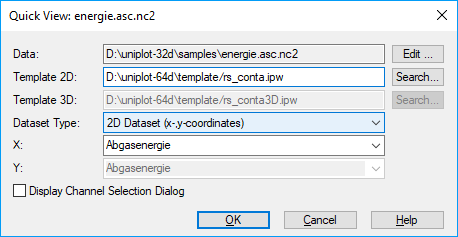
In the next dialog box you can specify how the data should be imported. You have a choice between: 1D-Dataset (Time signals or crank shaft related data): Every file channel will be loaded into a separate diagram.
2D-Dataset (e.g. Torque versus Speed): Select one channel that will be used as x-coordinates for all other channels.
3D-Dataset (e.g. an isoline map for fuel consumption versus torque and speed): Select one channel that will be used as x-coordinates and another channel as y-coordinates for all other channels.
VS-100/INCA (Bosch/ETAS): For VS100/INCA files, all channels will be plotted into separate diagrams.
Choose the OK button.
Comment
You’ll find the default template RS_CONTA.IPW in the
\UniPlot\Template\ directory. You can alter the default
template or create a new template, change the number of diagrams, add
a company logo, etc. If the document contains more than one page only
the first page will be used.
Misc_Datensatzstil_e: The selected dataset style displayed in the toolbar is
used to set the style (line color, marker, etc.) of a dataset. If the selected
style is not suited to the dataset (3D style for a 2D dataset or vice versa) the
style specified in the Tools=>Options dialog is used.
If the File Quick View template contains only one diagram the y-channel name of a 2D dataset and the z-channel name of a 3D dataset is used as the page name.
See also
id-601706