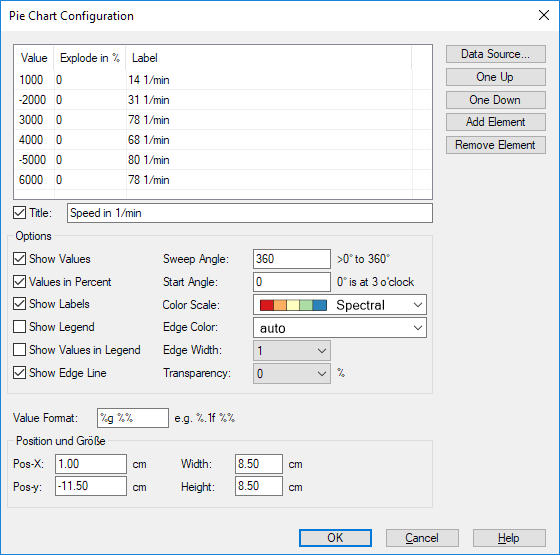
Diagram=>Pie Chart
The dialog box is used to configure a pie chart.
- Value list
List of all data points.
- One Up, One Down
Moves the selected element up.
- One Down
Moves the selected element down.
- Add Element
Adds an element to the list.
- Remove Element
Removes the selected element.
- Title
Sets the chart title.
- Show Values
If checked, the slices are labelled with their values.
- Values in Percent
If checked, the values are displayed in percent.
- Show Labels
If checked, the slice label are displayed outside the pie chart.
- Show Values in Legend
Display the values in the legend.
- Show Edge Line
Display the slices with an edge line.
- Sweep Angle
Total angle of the pie chart.
- Start Angle
The angle 0° degree is at 3 0’clock. The angle is measured counterclockwise.
- Color Scale
List of available color maps. See ColorScale_GetNames.
- Edge Color
Color used for edge line.
- Edge Width
Line width in 0.1 mm units.
- Transparency
Specifies the transparency in percent.
- Value Format
Specified a string to format the values. See printf.
- Pos-X, Pos-y, Width, Height
Specifies the position and size on the page in centimeters.
Comment
To open the dialog box, double click on the pie chart.
See also
id-420334