Data=>Cursor Data Table
This command creates a data table to display the cursor position of datasets that belong to the selected diagram or all x-axis linked diagrams. The data can be updated with the cursors.
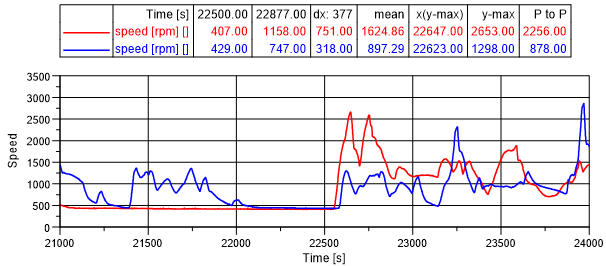
To create the data table:
Select a curve and press F5 to display the cursor.
Move the cursor to interesting x position.
Click with the right mouse key on the curve and select Cursor=>Data Table.
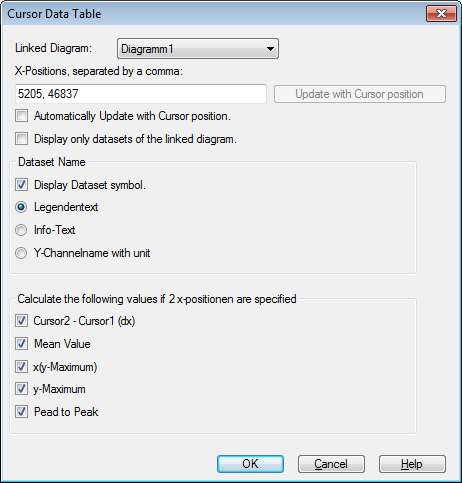
Configuration
To edit the data table right click on the table and select Cursor Data Table…. The following dialog box will be displayed:
See also
id-1493877