Creation of a Diagram Template
Note
Instead of the procedure described here, you can also create interactive templates as of UniPlot 3.4. See Stacked diagrams with multiple y axes.
First the result: The following figure displays the template that we would like to create:
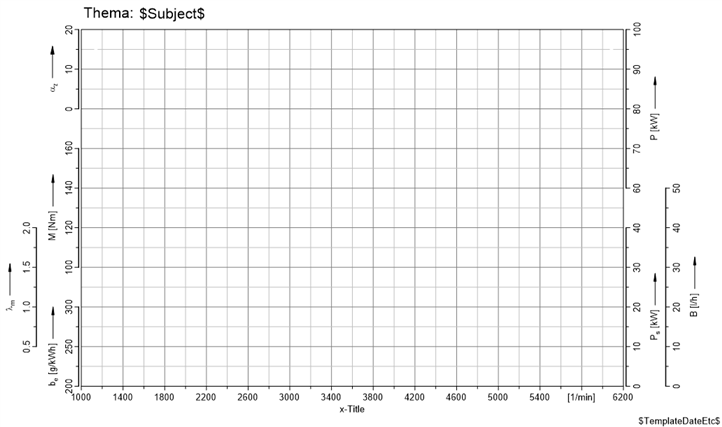
The figure shows a page with 7 diagrams: 4 diagrams on the left and 3 diagrams on the right hand side.
All diagrams use the same x-axis at the bottom.
The grid is a diagram displayed without any axes.
The y-axes are displayed with a little offset. The axes Lambda and B have an offset of 2 cm so that the axes title do not overlap.
The axes are scaled so that the tick marks match the gridlines. x-axis P displays a range from 68 to 100 kW (5 grid lines). The distance between two axes labels is 8 kW. If you would like to display data from an engine with e.g. 134 KW, you could change the scaling from 60 to 140 KW and a delta of 20 kW to create, once again, 5 labels.
The page contains 3 text objects, e.g. $TemplateDateEtc$ and a logo as well as a black frame around the all diagrams.
Now, we would like to show you how to create this template. In the first step, we will create a base template which will specify the size of the complete diagram (7 y-axes), the fonts, color, etc. In Step 2 we will create a description file and will show how UniPlot creates the template. In the last step we will add the text objects, logo and the black frame.
Step 1:
1.) Start UniPlot and open the file basis1.ipw in the
c:\Program Files\UniPlot\Template\Creator directory.
The file contains an A4 page with one diagram.
If you would like to change the format from portrait to landscape choose File=>Page Setup.
2.) Adjust size and position. Leave approx. 4 cm of free space on both sides of the diagram for the axis title. Double-click the diagram and edit the width and height (dx und dy), if necessary. Round values are preferred. Leave enough space for header data etc. Specify the number of grid lines. Choose Diagram=>X/Y/Z-Axis=>Parameters and set Minimum = 0, Maximum = 90 and Delta = 10 to create 10 grid lines (8 lines without the first and last line).
3.) Set the font for the axis title, grid line color (e.g. dark grey) etc..
4.) Save the document under a new name.
Step 2:
Start Microsoft-Excel and open the file basis1.xls in the
c:\Program Files\UniPlot\Template\Creator directory.
The file contains the following description:
#Axistitle |
Diagram name |
|
y-Min |
y-Max |
y-Delta |
Axis Offset |
Axis Position (left/right) |
b_{e} |
Diagram1 |
0 |
220 |
380 |
80 |
0 |
left |
M |
Diagram2 |
3 |
110 |
170 |
20 |
0 |
left |
a_{z} |
Diagram3 |
7 |
0 |
40 |
20 |
0 |
left |
l_{m} |
Diagram4 |
1 |
0.7 |
1.3 |
0.2 |
-2 |
right |
B20_{kor} |
Diagram5 |
0 |
0 |
40 |
8 |
2 |
right |
P_{S} |
Diagram6 |
0 |
0 |
32 |
8 |
0 |
right |
PEWG |
Diagram7 |
5 |
68 |
100 |
8 |
0 |
right |
Note
If you do not have Excel installed you can use a text editor (e.g. Notepad) to create the description file. Use a semicolon as the field separator (;) a period (.) as the decimal separator. If you would like to use spaces in the diagram names, put the name in quotes, e.g. “P ewg”.The table has 8 rows. The first row is a comment (comments start with a #-character). The other rows describe the diagrams.
The 8 columns have the following meaning:
- Column
Contains the axis title. a and l create the greek letter alpha and lambda, the characters “_{e}” and b_{e} create subscript.
- Column
Contains the diagram name.
- Column
Grid line at which the diagram should start. To start the axis at the bottom grid line type in 0.
- 4-6. Column
Minimum, Maximum and Delta of the axis scaling. Therefore the first diagram overlaps 3 grid lines: (380-220)/80 + 1 = 3 grid lines.
- Column
Axis offset. The lambda diagram and the B20 diagram are moved 2cm away from the grid lines. If you type in negative values, the axis will be moved into the grid.
- Column
Specifies the side on which the axis will be drawn.
Save the document under a new name.
Step 3:
Choose the command File=>More File Functions=>Create Diagram Template.
In the following dialog choose
c:\Program Files\UniPlot\Template\Creator\Basis1.xlsas the Diagram Template Description File andc:\Program Files\UniPlot\Template\Creator\Basis1.ipwas the Base Template File.Press OK to create the template.
id-460404