3D Classification of a XYZ-Dataset
Introduction
The Add-Ins “3D Classification of a XYZ-Dataset” can be used to classify map data. The bins in x- and y-direction can be specified. For each bin a statistic value can be calculated and saved as a matrix or displayed as a 3D bar plot.
Installation
Choose Tools=>Add-In Manager.
Check the “3D Classification of a XYZ-Dataset” addin.
Choose OK. Restart UniPlot.
The installed files are located in the
C:\Program Files\UniPlot\AddIn\RS_3DCLSdirectory.rs_3dcls.ic
UniScript File
rs_3dcls.icl
rs_3dcls.ic in object code
Usage
Choose File=>More File Functions. Choose the function “3D Classification of a XYZ-Dataset”.
In the following dialog box select a data file. The file will be converted into the netCDF format. If the NC file was created, the following dialog box will be displayed:
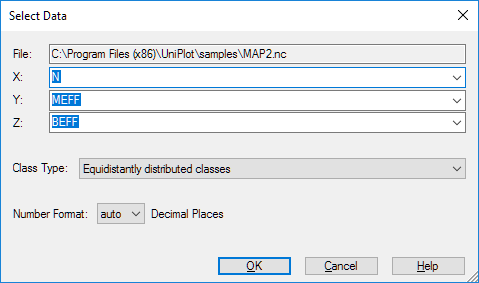
Choose a channel for x, y and z.
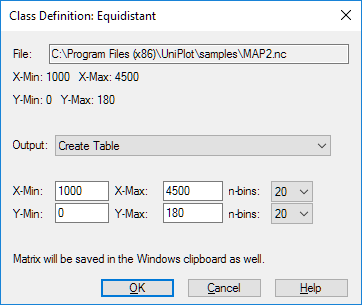
Equidistantly distributed classes: You can specify the number of bins:
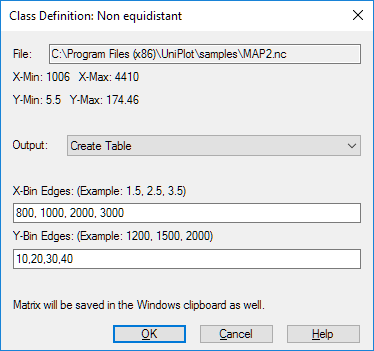
Non equidistantly distributed classes: You can specify the bin edges:
In the “output field” you select the output type.
Output
If the output Table is selected the function calculates the following
matrices: Minimum, Maximum, Mean, Median, Standard Deviation,
Sum, Points in Class
The following plots can be created as 3D bar plots:
Plot Minimum |
Plot Maximum |
Plot Mean |
Plot Median |
Plot Standard Deviation |
Plot Sum |
Plot Points in Class |
“Plot Percent of Sum(z)”; |
“Plot Points in Class in % (Relative Frequency)”; |
History
19.01.2010: Non equidistantly distributed classes modified: Uses bin edges instead of bin mid points.
28.04.2009: Data saved in clipboard.
26.11.2008: Dialog box modified.
10.07.2006: Documentation added.
id-993880