Diagram=>Create U3D Diagram
This command can be accessed by a “right mouse click menu” (context menu) on a diagram. The menu item will be displayed if a 3D dataset is available in the diagram.
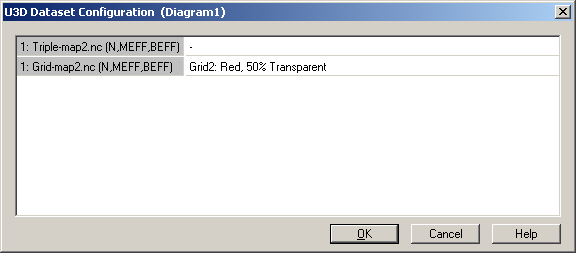
The dialog sets the display options for a U3D plot.
The dialog box lists all 3D-datasets of the selected diagram. If a dataset is created from x/y/z triples two elements will be displayed in the dialog box. For the “Triple” element, a marker style, a bar style or curve style can be selected. For the “Grid” element, a grid style can be selected.
4D Plot
In this plot type two datasets are used. One dataset is used to display the surface and the other is used to display the color gradient which is plotted on the surface.
Example:
The suface displays the fuel consumption and the color gradient displays the NOx emissions.
For the 4D plot both maps must have identical interpolations matrices. For example 40 rows and 40 columns with identical x, y coordinates.
See also
id-2009693