Data=>Cross-section (3D)
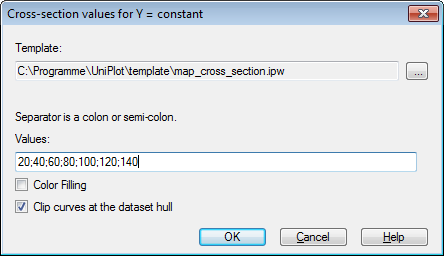
These functions create a new page with cross sections of the dataset. Cross section values are entered in a dialog box. Individual values must be separated by semi colons. The area under the section curves may be color filled. If the color fill option is marked the curves will appear in ascending order in the diagram.
A template can be selected in the dialog box. You will find the example
map_cross_section.ipw in the uniplot\template directory.
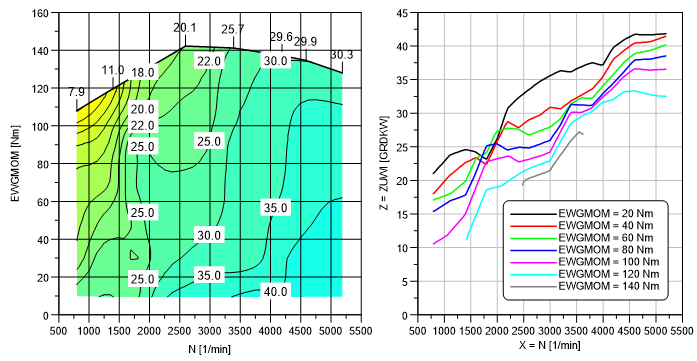
Result:
See also
id-432505