poly_line_clip
poly_line_clip calculates the intersections between two polygons.
- <rmXY, rmIDX> = poly_line_clip(nOption, clip, line)
Return Value
rmXY, rmIDX. The function returns two values. The return value rmXY is a matrix with two columns. The first column contains the x-coordinates and the second column the y_coordinates. It contains the original coordinates and the intersection points. The return value rmIDX is a matrix with two columns The first column contains the start index and the second column the end index of the line segment. For each segment the index matrix contains one row. If the line is completely outside or inside the clip polygon the return value rmIDX has only one element. If the value is 1 the polygon is completely inside. If the value is 0 the polygon is completely outside. .. us.params
Parameters
- nOption
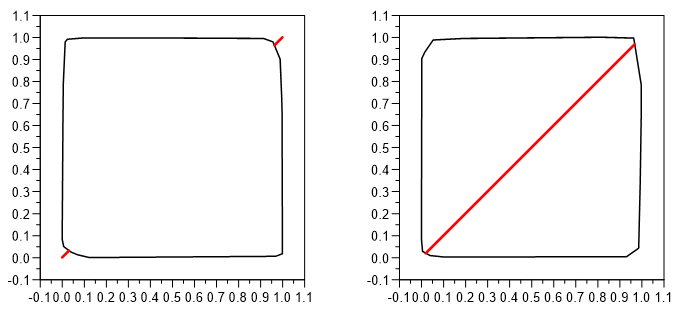
nOption: 0 == inside, 1 == outside.
- clip
clip are the x/y-coordinates of the clip polygon. The coordinates must be given as a complex vector (x + 1i*y) (see example).
- line
line are the x/y-coordinates of the subject polygon. The coordinates must be given as a complex vector (x + 1i*y) (see example).
Example
def test(option)
{
    idx = poly_hull(x = rand(1,1000), y = rand(1,1000))
    h = plot(x[idx], y[idx])
    h2 = plot(x, y, h[2])
    XYShowLine(h2[3], FALSE)
    clip = x[idx] + 1i*y[idx];
    subject = [0,1] + 1i* [0,1];
    <xy, idx> = poly_line_clip(option, clip, subject);
    print "xy:", xy, "idx", idx
    if (len(idx) == 1) {
        if (idx[1] == 1) {
            // draw complete line!
            plot(xy[;1], xy[;2], h[2]);
            return TRUE;
        } else {
            // all points outside!
            return TRUE;
        }
    } else {
        for (i in 1:nr(idx)) {
            plot(xy[idx[i;];1], xy[idx[i;];2], h[2])
        }
    }
    LayerSetAxisMinMaxDelta(h2[2], "X", -0.1, 1.1, 0.1)
    LayerSetAxisMinMaxDelta(h2[2], "Y", -0.1, 1.1, 0.1)
    LayerShowGrid(h2[2], "X", FALSE, FALSE)
    LayerShowGrid(h2[2], "Y", FALSE, FALSE)
    LayerSetAxisTitle(h2[2], "X", "")
    LayerSetAxisTitle(h2[2], "Y", "")
    PageReplot(h2[1])
}
See also
id-12861