Dialogfeld=>Bubbleplot Optionen
The position of the data points in the x/y coordinate system can represented by symbols (cross, circle, square, etc.).
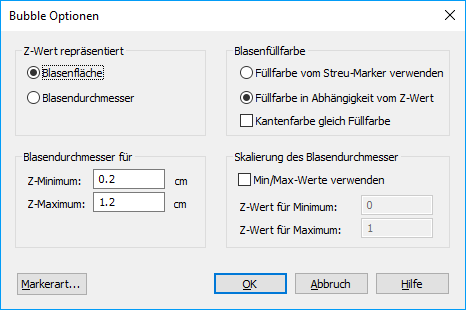
With this dialog box you can set the style, color and size of the symbols.
- Type
The following symbols are available:
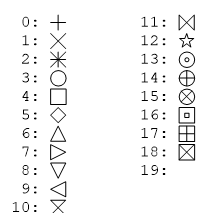
- Fill Color
Fill the inner area (square, triangle, etc.) of the symbol with the colors listed in this box.
- Size
The size of the symbol is set in centimeters.
- Edge Color
Displays the colors available with which the symbol’s edge can be colored.
- Edge Width
The width of the symbol’s edge can be set in steps of 0.1 mm.
Kommentar
If you would like to add a gab betwenn the symbol and the conntected line of a 2D dataset, choose white as the edge color. The line width will set the gab width.
id-395746