XYZSetProps
XYZSetProps setzt Eigenschaften eines x/y/z-Datensatzes.
- bool = XYZSetProps(hData, ssProps)
Returnwert
bool ist TRUE (1) wenn alle Eigenschaften erfolgreich gesetzt werden konnte, und sonst FALSE (0).
Parameter
- hData
hData ist die Zugriffsnummer (Handle) des Datensatzes, der mit XYZCreate erzeugt wurde.
- ssProps
ssProps ist ein String mit
NAME='WERT'-Paaren mit den Eigenschaften.
Beispiel
Der folgende Beispielaufruf schaltet den Bubble-Plot ein und die Isolinien-Anzeige aus. Die anderen Eigenschaften des Datensatzes werden nicht geändert.
XYZSetProps(hData, "bubble='1' isolines='0'")
Isolinien berechnen und beschriften:
XYZSetProps(hData, "iso-values='auto' iso-label-type='auto'")
Weiteres Beispiel:
XYZSetProps(hData, "hull-label-distance='0.2' " + ...
        "marker='1' marker-label='0' " +  ...
        "iso-pen-color='silver' iso-values = 'auto:15' " + ...
        "iso-label-type ='random'");
Isolinienfarben setzen:
rmColor = [255,0,0;  255,127,0;  0,255,0;  0,0,255];
// the last color (blue) will be used for all remaining iso lines
// (5., 6., etc.).
ssColor = sty_RGB_to_prop_color(rmColor);
ssProp = sprintf("iso-pen-color = '%s'", ssColor);
XYZSetProps(hData, ssProp);
Kommentar
In der folgenden Tabelle sind alle Eigenschaften (Properties), die gesetzt werden können, aufgeführt. In der Spalte Typ wird der Wertebereich der Eigenschaften festgelegt. Folgende Typen existieren: bool, int, double, color, curve_style, marker_style.
bool kann die Werte ‚0‘ oder ‚1‘ annehmen. ‚0‘ bedeutet ausgeschaltet (off, false) und ‚1‘ eingeschaltet (on, true).
int ist eine ganze Zahl (‚1‘, ‚-1‘, ‚144‘).
double ist eine Gleitkommazahl wie ‚1.23‘, ‚5000‘, ‚1e3‘.
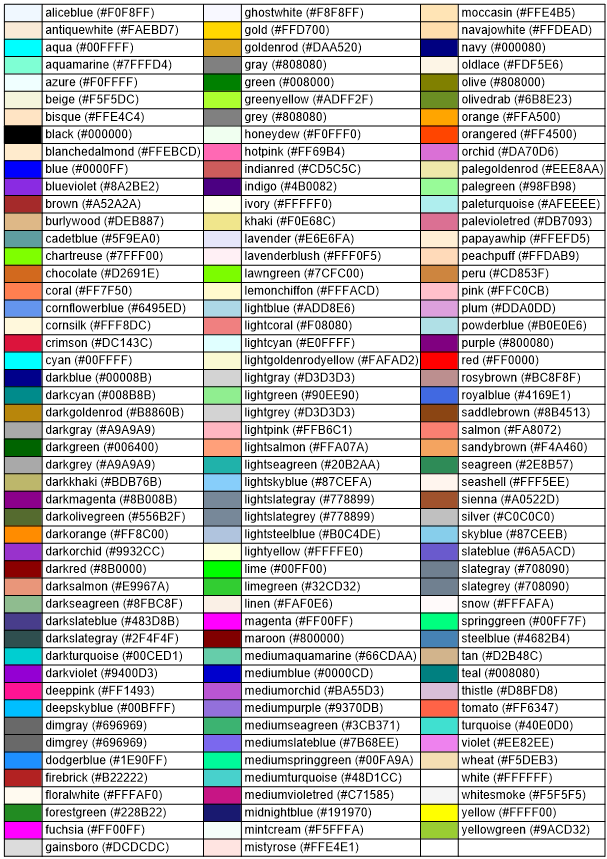
color ist ein Name wie ‚mediumblue‘ (siehe Farbtabelle unten), ein Zahlenwert wie ‚#0000CD‘ oder ein Ausdruck der Form ‚rgb(0,0,205)‘.
Eigenschaften alphabetisch:
Eigenschaft |
Typ |
Default-Wert |
Kommentar |
|---|---|---|---|
base-value-3d |
double |
|
|
bubble |
bool |
|
|
bubble-color-type |
int |
|
|
bubble-size-max |
double |
|
Maximale Bubble-Größe in Zentimeter |
bubble-size-min |
double |
|
Minimale Bubble-Größe in Zentimeter |
bubble-scale-max |
double |
|
Falls |
bubble-scale-min |
double |
|
Falls |
bubble-size-type |
int |
|
1: Durchmesser, 2: Fläche |
bubble-no-edge |
int |
|
Falls dieser Wert auf 1 gesetzt ist, wird eine Kante angezeigt. |
bubble-use-scaleval |
int |
|
Falls dieser Wert auf 1 gesetzt ist, wird der Min/Max-Wert zum Berechnen der Bubble-Größe benutzt. |
color-matrix |
bool |
|
|
color-matrix-line-color |
color |
black |
|
color-matrix-line-width |
int |
|
|
color-matrix-showzval |
bool |
|
|
color-matrix-cliptext |
bool |
|
|
color-matrix-shrinktext |
bool |
|
|
color-matrix-showedge |
bool |
|
|
color-matrix-clipzmin |
bool |
|
|
filled |
bool |
|
|
hull-label |
bool |
|
|
hull-label-distance |
double |
|
in Zentimeter |
hull-label-horizontal |
bool |
|
|
hull-pen-color |
color |
|
|
hull-pen-style |
curve_style |
|
possible values: ‚0‘ or ‚solid‘ , ‚1‘ or ‚dash‘, ‚2‘ or’dot‘, ‚3‘ or ‚dashdot‘, ‚4‘ or ‚dashdotdot‘. |
hull-pen-width |
int |
|
|
hull-spline |
bool |
|
|
hull-type |
int |
|
|
inside-3d-pen-color |
color |
|
|
inside-3d-pen-style |
curve_style |
|
possible values: ‚0‘ or ‚solid‘ , ‚1‘ or ‚dash‘, ‚2‘ or’dot‘, ‚3‘ or ‚dashdot‘, ‚4‘ or ‚dashdotdot‘. |
inside-3d-pen-width |
int |
|
|
inside-color-3d |
color |
|
|
interpolation-density |
string |
|
|
interpolation-on-grid |
bool |
|
|
interpolation-range |
string |
|
|
interpolation-smooth-factor |
int |
|
|
interpolation-type |
int |
|
‚1‘ (linear Interpolation), ‚2‘ (Non linear Interpolation), ‚3‘ (Thin-Plate-Spline Interpolation) |
iso-colors |
string |
|
|
iso-colors-alpha |
string |
|
|
iso-colormap |
string |
|
|
iso-colormap-enable |
bool |
|
|
iso-label-type |
string |
|
|
iso-min-color |
string |
|
|
iso-min-color-alpha |
int |
|
|
iso-pen-color |
string |
|
|
iso-pen-styles |
string |
|
possible values: ‚0‘ or ‚solid‘ , ‚1‘ or ‚dash‘, ‚2‘ or’dot‘, ‚3‘ or ‚dashdot‘, ‚4‘ or ‚dashdotdot‘. |
iso-pen-width |
string |
|
|
iso-values |
string |
|
|
isolines |
bool |
|
|
isolines-3d |
bool |
|
|
label-font-angle |
double |
|
|
label-font-color |
color |
|
|
label-font-face-name |
string |
|
|
label-font-height |
int |
|
|
label-font-italic |
bool |
|
|
label-font-pitch-and-family |
int |
|
|
label-font-strikeout |
bool |
|
|
label-font-underline |
bool |
|
|
label-font-weight |
int |
|
|
label-format |
string |
|
|
label-in-a-box |
bool |
|
|
label-in-line-color |
int |
|
|
label-transparent |
bool |
|
|
label-orientation |
int |
|
|
marker |
bool |
|
|
marker-edge-color |
color |
|
|
marker-edge-width |
int |
|
|
marker-fill-color |
color |
|
|
marker-fill-alpha |
int |
|
|
marker-label |
bool |
|
|
marker-label-font-angle |
double |
|
|
marker-label-font-color |
color |
|
|
marker-label-font-face-name |
string |
|
|
marker-label-font-height |
int |
|
|
marker-label-font-italic |
int |
|
|
marker-label-font-pitch-and-family |
int |
|
|
marker-label-font-strikeout |
int |
|
|
marker-label-font-underline |
int |
|
|
marker-label-font-weight |
int |
|
|
marker-line-index |
bool |
|
|
marker-size |
double |
|
|
marker-style |
marker_style |
|
|
max-marker |
bool |
|
|
max-marker-edge-color |
color |
|
|
max-marker-edge-width |
int |
|
|
max-marker-fill-color |
color |
|
|
max-marker-fill-alpha |
int |
|
|
max-marker-size |
double |
|
|
max-marker-style |
marker_style |
|
Siehe XYSetProps |
min-marker |
bool |
|
|
min-marker-edge-color |
color |
|
|
min-marker-edge-width |
int |
|
|
min-marker-fill-color |
color |
|
|
min-marker-fill-alpha |
int |
|
|
min-marker-size |
double |
|
|
min-marker-style |
marker_style |
|
Siehe XYSetProps |
name |
string |
|
|
outside-3d-pen-color |
color |
|
|
outside-3d-pen-style |
curve_style |
|
possible values: ‚0‘ or ‚solid‘ , ‚1‘ or ‚dash‘, ‚2‘ or’dot‘, ‚3‘ or ‚dashdot‘, ‚4‘ or ‚dashdotdot‘. |
outside-3d-pen-width |
int |
|
|
outside-color |
color |
|
|
outside-hull-3d-type |
int |
|
|
scatter-bar-width |
double |
|
|
scatter-label-offset-x |
double |
|
|
scatter-label-offset-y |
double |
|
|
spline |
bool |
|
|
surface-attributes |
int |
|
|
surface-type |
int |
|
|
triangulation |
bool |
|
Eigenschaften in Kategorien:
Isolinien
Eigenschaft |
Typ |
Default-Wert |
|---|---|---|
isolines |
bool |
|
spline |
bool |
|
iso-values |
string |
|
filled |
bool |
|
iso-min-color |
string |
|
iso-colors |
string |
|
iso-colors-alpha |
string |
|
iso-pen-color |
string |
|
iso-pen-styles |
string |
|
iso-pen-width |
string |
|
Anmerkungen:
iso-values legt fest, welche Isolinien gezeichnet werden. iso-values ist
entweder der String „auto“, oder ein String mit komma-separierten
Zahlen („22.3,25,100,200,500.12“). Dem String „auto“ kann noch ein Doppelpunkt
mit einer Zahl im Bereich von 1 bis 100 folgen, um die Anzahl an automatisch
ermittelten Isolinien festzulegen, z. B. „auto:6“. Der Text „auto:linear,XX“
führt eine lineare Skalierung druch. XX steht für die Anzahl der gewünschten
Isolinienwerte, z. B. „auto:linear,10“
iso-min-color wird verwendet, wenn „filled=‘1‘“ ist.
iso-colors ist eine einzelne Farbe oder eine komma-separierte Liste von Farben. Falls iso-values=‘auto‘ ist, wird iso-min-color und die letzte Farbe von iso-colors verwendet um einen Farbverlauf zu bestimmen. Falls iso-values eine Liste von Werten ist, muss iso-colors die gleiche Anzahl an Farben wie iso-values Werte haben, ansonsten wird wie bei iso-values=‘auto‘ ein Farbverlauf aus der letzten Farbe von iso-colors und iso-min-color berechnet.
iso-pen-color, iso-pen-styles, iso-pen-width sind komma-separierte Listen. Falls die Anzahl nicht mit der Anzahl an Werten in iso-values übereinstimmt, wird die Liste mit dem letzten Wert der Liste aufgefüllt.
Isolinien-Beschriftungen
Eigenschaft |
Typ |
Default-Wert |
|---|---|---|
iso-label-type |
string |
|
label-format |
string |
|
label-in-a-box |
bool |
|
label-in-line-color |
int |
|
label-transparent |
bool |
|
label-orientation |
int |
|
label-font-angle |
double |
|
label-font-color |
color |
|
label-font-face-name |
string |
|
label-font-height |
int |
|
label-font-italic |
bool |
|
label-font-pitch-and-family |
int |
|
label-font-strikeout |
bool |
|
label-font-underline |
bool |
|
label-font-weight |
int |
|
Anmerkungen:
iso-label-type ist einer der folgenden Werte
‚none‘ oder ‚0‘ |
bewirkt, das keine Label an die Isolinie gezeichnet werden. |
‚user‘ oder ‚1‘ |
bewirkt, das die Label nicht geändert werden. |
‚stripes‘ oder ‚2‘ |
zieht zwei gedachte, vertikale Geraden und beschriftet die Isolinien an den gedachten Schnittpunkten der Geraden mit den Isolinien, |
‚middle‘ oder ‚3‘ |
bewirkt, dass eine Beschriftung für jede Isoline in der Mitte ausgegeben wird. |
‚random‘ oder ‚4‘ |
erzeugt ein Label an einer zufälligen Stelle. |
‚auto‘ |
ist dasselbe wie ‚random‘. |
label-format ‚auto‘ oder eine Zahl (siehe XYZSetLabelFormat).
label-transparent Die Isolinienbeschriftungen werden transparent ausgegeben, wenn der Wert auf ‚1‘ gesetzt wird. Ansonsten wird die Beschriftung mit einem weißen Rechteck unterlegt.
Bubble-Plots
Eigenschaft |
Typ |
Default-Wert |
|---|---|---|
bubble |
bool |
|
bubble-color-type |
int |
|
bubble-size-max |
double |
|
bubble-size-min |
double |
|
bubble-size-type |
int |
|
Anmerkungen:
bubble-color-type ‚1‘ einfarbig, ‚2‘ farbgradient.
bubble-size-type ‚1‘ z-Wert proportional zur Fläche des Markers, ‚2‘ z-Wert proportional zum Durchmesser des Markers.
Hülle
Eigenschaft |
Typ |
Default-Wert |
|---|---|---|
hull-label |
bool |
|
hull-label-distance |
double |
|
hull-label-horizontal |
bool |
|
hull-pen-color |
color |
|
hull-pen-style |
curve_style |
|
hull-pen-width |
int |
|
hull-spline |
bool |
|
hull-type |
int |
|
Anmerkungen:
hull-type legt den Hüllentyp fest.
‚0‘ |
keine Hülle (HULL_NONE) |
‚1‘ |
nördlicher Teil (HULL_NORTH) |
‚2‘ |
nördlicher Teil (Splineverbindung) (HULL_NORTH_SPLINE) |
‚3‘ |
Gesamthülle (HULL_ENTIRE) |
‚4‘ |
Gesamthülle - nördlicher Teil mit Splineverbindung (HULL_ENTIRE_SPLINE) |
‚5‘ |
benutzer-definierte Hülle (HULL_USERDEF) |
3D-Oberflächen-Plots
Eigenschaft |
Typ |
Default-Wert |
|---|---|---|
base-value-3d |
double |
|
inside-3d-pen-color |
color |
|
inside-3d-pen-style |
curve_style |
|
inside-3d-pen-width |
int |
|
inside-color-3d |
color |
|
outside-3d-pen-color |
color |
|
outside-3d-pen-style |
curve_style |
|
outside-3d-pen-width |
int |
|
outside-color |
color |
|
outside-hull-3d-type |
int |
|
surface-attributes |
int |
|
surface-type |
int |
|
isolines-3d |
bool |
|
Anmerkungen:
surface-type legt die Darstellung der Oberfläche fest (siehe XYZSet3DSurfaceType). Wertebereich ist ‚0‘ bis ‚7‘.
Interpolation
Eigenschaft |
Typ |
Default-Wert |
|---|---|---|
interpolation-density |
string |
|
interpolation-on-grid |
bool |
|
interpolation-range |
string |
|
interpolation-smooth-factor |
int |
|
interpolation-type |
int |
|
Anmerkungen:
Bedeutung der Werte interpolation-type:
Wert |
Bedeutung |
|---|---|
1 |
linear Interpolation |
2 |
Nicht lineare Interpolation |
3 |
Thin-Plate-Spline Interpolation |
Streuplots
Eigenschaft |
Typ |
Default-Wert |
|---|---|---|
marker |
bool |
|
marker-edge-color |
color |
|
marker-edge-width |
int |
|
marker-fill-color |
color |
|
marker-fill-alpha |
int |
|
marker-label |
bool |
|
marker-label-font-angle |
double |
|
marker-label-font-color |
color |
|
marker-label-font-face-name |
string |
|
marker-label-font-height |
int |
|
marker-label-font-italic |
int |
|
marker-label-font-pitch-and-family |
int |
|
marker-label-font-strikeout |
int |
|
marker-label-font-underline |
int |
|
marker-label-font-weight |
int |
|
marker-line-index |
bool |
|
marker-size |
double |
|
marker-style |
marker_style |
|
max-marker |
bool |
|
max-marker-edge-color |
color |
|
max-marker-edge-width |
int |
|
max-marker-fill-color |
color |
|
max-marker-fill-alpha |
int |
|
max-marker-size |
double |
|
max-marker-style |
marker_style |
|
min-marker |
bool |
|
min-marker-edge-color |
color |
|
min-marker-edge-width |
int |
|
min-marker-fill-color |
color |
|
min-marker-fill-alpha |
int |
|
min-marker-size |
double |
|
min-marker-style |
marker_style |
|
Farbmatrizen
Eigenschaft |
Typ |
Default-Wert |
|---|---|---|
color-matrix |
bool |
0 |
color-matrix-line-color |
color |
black |
color-matrix-line-width |
int |
2 |
color-matrix-showzval |
bool |
1 |
color-matrix-cliptext |
bool |
1 |
color-matrix-shrinktext |
bool |
1 |
color-matrix-showedge |
bool |
1 |
color-matrix-clipzmin |
bool |
0 |
Sonstiges
Eigenschaft |
Typ |
Default-Wert |
|---|---|---|
name |
string |
|
scatter-bar-width |
double |
|
scatter-label-offset-x |
double |
|
scatter-label-offset-y |
double |
|
triangulation |
bool |
|
Anmerkungen zur Spalte Typ finden Sie unter XYSetProps.
Weitere Informationen finden Sie in der Datei script\do_sty4.ic.
Farbtabelle
History
Version |
Beschreibung |
|---|---|
5.30 |
Farbmatrix-Attribute zugefügt. label-transparent zugefügt. |
4.0.3 |
Neu. |
Siehe auch
Überblick XYZ-Datensätze, XYZGetProps, XYZSetDefault, XYSetProps
id-1762688