Overview Automation
When creating a number of similar reports, it is recommended to automate this task.
Automation from the user’s point of view
Choose a category from the Report menu, e. g. Map Plots. A list of available reports will be displayed. Example:
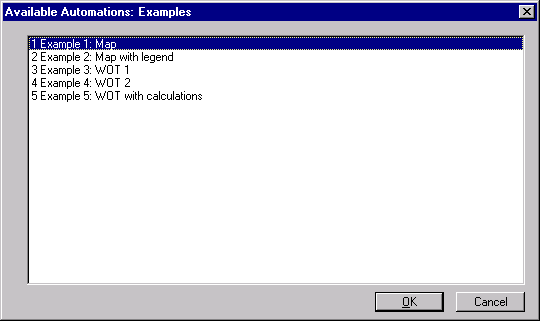
Select a report. The next step is to select data files from the following dialog:
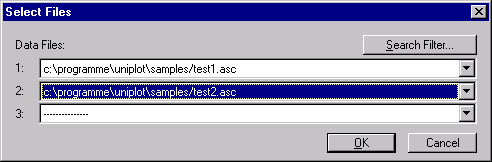
Up to 16 data files can be selected depending on the chosen automation script.
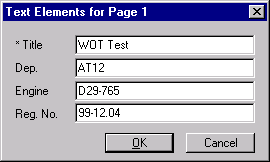
A template will be opened and the data will be loaded into the diagrams. Header data will be inserted into the template. The creation of the page ends when a dialog box for the input of additional text data appears:
Creating an automation
An automation consists of two files:
IC file: The ic file (script file) contains the program which will control the execution of the automation. The script file should have the file name extension
.ic.IPW file: The ipw file (UniPlot document) contains the template with diagrams, text fields logos etc. The UniPlot document should have the file name extension
.ipw.
The ic and the ipw files should be saved in the same directory. To install the
automation, the directory where the two files are stored must be specified in the
Tools=>More Options dialog box, in the field
Search path for automation script files (e.g.
c:\uniplot\samples\automate). Multiple directories can be specified
and must be separated by a semi-colon (;). After the dialog box is closed, all
IC files in the specified directories will be loaded.
The template file (.ipw)
The template is a ordinary UniPlot document containing diagrams, text and drawing objects, logos, OLE objects and all other possible UniPlot objects.
Diagrams
The scaling of the diagram axes should be set up in the template in such a way that the diagrams will display the interesting part of the data. If the data varies significantly, the axes can be autoscaled in the script file. x- and y-axes can be scaled independently (see auto_ScaleAxes). Each diagram on a page has an unique name. The name will be used in the script file to access a diagram and to add data to a diagram.
Text Objects
The template can contain any number of text place-holders which will be replaced
during the execution of an automation script by user input or by text received
from the data file. The place-holder is text that begins with a dollar sign,
followed by the text, followed by another dollar sign. Example: $Engine$.
To set an order to display the place-holder text in the dialog box, an optional
number can be added to the place-holder. Example: $(1)Title$. The number must
be surrounded by brackets and must be placed behind the first dollar sign.
If the text of a place-holder should be received from a data file, the spelling
and case must be identical to one global attribute in the NC file. Normally,
every NC file created by UniPlot has a global attribute "Origin" containing
the file name of the original data file. The placeholder text for this attribute
will be $Origin$. To read the attribute value of a variable, the variable
name must be followed by a period followed by the name of the attribute. Example:
$Torque.long_name$.
Legends and Field Functions
Every page can have one legend. The legend is a normal text object. (To create a
text object, select the  button from the toolbar and drag the
mouse). The text of the text object must appear in this format:
button from the toolbar and drag the
mouse). The text of the text object must appear in this format: $LEGEND$.
The template can contain field functions. Multiple legends can be created (see
Field Functions) for a page by using field functions. To create a legend
for a specific diagram, add a text object to the diagram and type in the text
@f{legend}.
To create a field function that displays the document name, create a text
element and type @f{documentname} into the element
(File=>More File Functions item Add filename to document page).
A template file can contain multiple pages. Which page is loaded and in what order will be specified in the ic-file.
The ic file
The script file (.ic) is a text file containing a program which controls the execution of the automation. To create a script file, open a program editor (File=>New). To edit an existing script file, choose File=>Open.
The following examples are used to describe different sections of an automation
script file. The examples can be found in the directory
UniPlot\Samples\Automate.
To enable UniPlot to execute the following examples, load the automation scripts
into UniPlot. Choose Tools=>More Options. In the dialog box that appears,
specify the path of the ic file in the Search Path for Automation Script Files
text field (e.g. C:/Program Files/Uniplot/Samples/Automate/). Click the
OK button. A new Reports menu should be added to the main menu.
Select the category Examples=>Example 1: Map. In the data file dialog box
that appears, select the example file map-data.xls.
auto_AddToUI("Examples", "Example 1: Map", "RS_Example1");

def RS_Example1()
{
    MessageBox("In the following dialog please select the file map-data.xls");
    auto_SetFileNameDialogInit("*.xls", GetRootDirectory() + "samples/");
    svFile = auto_GetFileNameDialog(1);
    if (svFile[1] == "DLG_CANCEL") {
        return;
    }
    auto_LoadTemplate(GetRootDirectory() + "samples/automate/Example.ipw");
    auto_ImportData(svFile[1]);
    auto_LoadDataset("Diagramm 1", "N", "EWGMOM", "EWGLST");
    auto_LoadDataset("Diagramm 2", "N", "EWGMOM", "BEEWG");
    auto_ScaleAxes();
    auto_UpdatePage();
}
The function RS_Example1 controls the execution of the automation. This function is called when the user selects the respective menu Report=>Example 1: Map.
The function call auto_AddToUI (UI for User-Interface) inserts a new menu
item to the Reports menu, if this menu item is not already available, and adds a
new item to the listbox ("Example 1: Map").
The script function RS_Example1 will then be registered so that Reports=>Examples=>Example 1: Map can be called from the menu.
The function has three parameters:
For each automation the auto_AddToUI function will be called up once.
The first parameter sets the name of the menu to which the evaluation should be assigned.
The function’s second parameter ("Example 1: Map") will appear in the dialog
box when the Evaluation=>Example-Evaluation menu is chosen.
The third parameter ("RS_Example1") is the name of the function
to be called up. The name can be chosen freely. Because each
function name in UniScript can only be used once, make sure the name
does not already exist. It is recommended to start the name with a
prefix not already in use by UniPlot e.g. rs_ or abc_ etc.
With the help of the what function, it is possible to check if functions
with the prefix already exist in UniPlot. To do this, open the command window and
enter, for example, what("RSB_*"). A list will appear with all the functions
that begin with RSB_. The script file should be saved with a template file in
the same directory. For example: uniplot\template\auto.
Automations can be located in various directories. The search directory is set in the Tools=>More Options dialog box. Search directories are entered in the Search Path for automation script files. The paths must be separated by a semi-colon (;). Only automation script files should be saved in these directories.
When starting UniPlot, the script files will be searched and opened in the paths given. The script files must have the name extension .ic.
All UniScript functions can be called up within a script function. To simplify the writing of script files, prepared functions are available for standard functions such as Choose Files, Search and Replace Text, and for the calculation of data.
These functions are briefly described here:
The user can choose data files with this function. The function returns the name
of the chosen file as a vector. If the Cancel button is chosen, the character
string "DLG_CANCEL" will be returned as the first element of the vector. If
more than 4 files should be chosen, the number is entered in the function as the
first parameter. For example, calling auto_GetFileNameDialog(8) gives the
user the possibility to choose up to 8 files. A maximum of 16 files can be
chosen.
This function searches the template page for text matching the place holder
pattern ($Text$). If the text is found in the template page, a dialog box
will appear. With its help, the text can be entered. If a NC file name
(return value of the auto_ImportData function) is entered, the function
tries to find the place-holder text in the global attributes or the variable
attributes of the NC file. All of the loaded text from the NC file will be marked
with an astrix in the dialog box.
This function opens a template and creates a copy of the required page. The copied page will be inserted into either a new document or in the active document.
The first parameter is the name of the template. If the template originates from one of the entered automation script directories, the path should not be entered.
The second parameter is the name of the page. If the page is to be inserted to the active document, the auto_AddPage function should be called first. (See Example RS_Example4).
The function returns the handle of the created page. The handle can be used, for example, to retrieve the handle of a diagram (PageGetLayerHandle).
This function opens the given data file and converts it to NC format. The file name is given as the first parameter. The name of the NC file will be returned as a return value. The NC file name can be used, for example, for the auto_ReplaceTextDialog function.
The name of the created NC file will be saved as a global variable. The auto_LoadDataset function uses this variable to load data from the NC file to a given diagram.
The auto_LoadDataset function creates an 1D, 2D or 3D dataset. The dataset will be inserted into the given diagram. The function returns a handle which will be used to access the dataset.
The dataset style will be taken from the active style file. The first dataset in the diagram receives the first style from the file, the second dataset receives the second style in the file and so on.
To set the style for the next dataset being created by auto_LoadDataset, call the auto_SetDatasetStyle function. The style can be passed by name or index.
This function should be called in order to finish the creation of a page.
Create a map with a color legend:
auto_AddToUI("Examples", "Example 2: Map with legend", "RS_Example2");

def RS_Example2()
{
    MessageBox("In the following dialog please select the file map-data.xls");

    auto_SetFileNameDialogInit("*.xls", GetRootDirectory() + "samples/");
    svFile = auto_GetFileNameDialog(1);
    if (svFile[1] == "DLG_CANCEL") {
        return;
    }
    auto_LoadStyleFile(GetRootDirectory() + "samples/automate/style1.icb");
    hPage = auto_LoadTemplate(GetRootDirectory() + "samples/automate/Example.ipw");
    auto_ImportData(svFile[1]);
    hData = auto_LoadDataset("Diagramm 1", "N", "EWGMOM", "EWGLST");
    auto_xyz_CreateColorLegend(hData)
    auto_LoadDataset("Diagramm 2", "N", "EWGMOM", "BEEWG");
    auto_ReplaceText("$X-Title$", "Dies ist die Y-Achse");
    auto_ReplaceTextDialog()
    auto_UpdatePage();
}
In the following example, up to 3 data files can be chosen:
auto_AddToUI("Examples", "Example 3: WOT 1", "RS_Example3");

def RS_Example3()
{
    MessageBox("In the following dialog please select the file VOLLAST.ASC");
    auto_SetFileNameDialogInit("*.asc; *.nc", GetRootDirectory() + "samples/");
    svFile = auto_GetFileNameDialog(3);
    if (svFile[1] == "DLG_CANCEL") {
        return;
    }
    NumberOfFiles = len(svFile);

    hPage = auto_LoadTemplate("example");

    for (i in 1:NumberOfFiles) {
        svFile[i] = auto_ImportData(svFile[i]);
        auto_LoadDataset("Diagramm 1", "N", "MEFF");
        auto_LoadDataset("Diagramm 2", "N", "EWGLST");
    }
    auto_ScaleAxes();
    auto_ReplaceTextDialog(svFile[1]);
    auto_UpdatePage();
}
The following example creates a document with 2 pages. The first page shows the data (N, MEFF) and (N, EWGLST) and the second page displays the data (N, BEFF) and (N, TOEL1).
auto_AddToUI("Examples", "Example 4: WOT 2", "RS_Example4");

def RS_Example4()
{
    MessageBox("In the following dialog please select the file VOLLAST.ASC");
    auto_SetFileNameDialogInit("*.asc; *.nc", GetRootDirectory() + "samples/");
    svFile = auto_GetFileNameDialog(3);
    if (svFile[1] == "DLG_CANCEL") {
        return;
    }
    NumberOfFiles = len(svFile);

    hPage = auto_LoadTemplate("example");

    for (i in 1:NumberOfFiles) {
        svFile[i] = auto_ImportData(svFile[i]);
        auto_LoadDataset("Diagramm 1", "N", "MEFF");
        auto_LoadDataset("Diagramm 2", "N", "EWGLST");
    }
    auto_ScaleAxes();
    auto_ReplaceTextDialog(hPage, svFile[1]);
    auto_UpdatePage();

    // Add the next page to the active Page
    auto_AddPage();

    hPage = auto_LoadTemplate("example");

    for (i in 1:NumberOfFiles) {
        svFile[i] = auto_ImportData(svFile[i]);
        auto_LoadDataset("Diagramm 1", "N", "BEFF");
        auto_LoadDataset("Diagramm 2", "N", "TOEL1");
    }
    auto_ScaleAxes();
    auto_ReplaceTextDialog(hPage, svFile[1]);
    auto_UpdatePage();
}
This example shows how the average value of two curves can be calculated and how two datasets can be divided.
auto_AddToUI("Examples", "Example 5: WOT with calculations", "RS_Example5");

def RS_Example5()
{
    MessageBox("In the following dialog please select the file VOLLAST.ASC");
    auto_SetFileNameDialogInit("*.asc; *.nc", GetRootDirectory() + "samples/");
    svFile = auto_GetFileNameDialog(2);
    if (svFile[1] == "DLG_CANCEL") {
        return;
    }
    NumberOfFiles = len(svFile);
    if (NumberOfFiles != 2) {
        MessageBox("Es müssen 2 Dateien ausgewählt werden");
        return FALSE;
    }

    hPage = auto_LoadTemplate("example");

    svFile[1] = auto_ImportData(svFile[1]);
    hData1 = auto_LoadDataset("Diagramm 1", "N", "MEFF");

    svFile[2] = auto_ImportData(svFile[2]);
    hData2 = auto_LoadDataset("Diagramm 1", "N", "MEFF");

    // Retrieve the handle of Diagramm 2
    hLayer2 = PageGetLayerHandle(hPage, "Diagramm 2");

    // Calculate Mean dataset
    auto_xy_Mean(hData1, hData2);

    // Calculate Div dataset and add to "Diagramm 2".
    auto_xy_Div([hData1, hLayer2], hData2);

    // Autoscale axes
    auto_ScaleAxes();
    auto_ReplaceTextDialog(hPage, svFile[1]);
    auto_UpdatePage();
}
The function auto_xy_Mean calculates the average of 2 datasets (curves). The datasets must have ascending x-coordinates and overlap in the x-direction. The x-coordinates of the two datasets do not have to be identical.
Datasets will be passed to the function with their handles. Handles are returned from the function auto_LoadDataset.
The auto_xy_Mean function, like the auto_LoadDataset function, returns the handle of the created dataset. If the dataset cannot be created, the function returns the value 0.
To delete a dataset from a diagram, call up the XYDestroy or XYZDestroy function.
id-644140