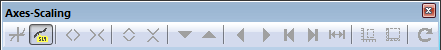
Toolbar=>Scaling
To enable the toolbar buttons select a diagram.
- Display Data Cursor
- see Data=>Data Cursor.
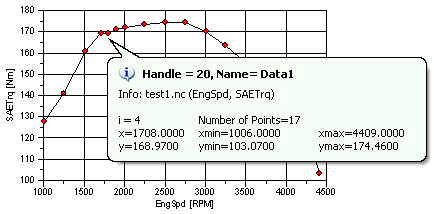
Data Tooltip
- Increase X Axis range
- Increases the x-axis range by one delta step on both sides of the axes and autoscales the axis with the new axis range. One delta step is the distance between two axis labels.
- Reduce X Axis range
- Decreases the x-axis range by one delta step on both sides (see above) and autoscales the axis with the new axis range.
- Increase Y Axis range
- Increases the y-axis range by one delta step on both sides of the axes and autoscales the axis with the new axis range.
- Reduce Y Axis range
- Decreases the y-axis range by one delta step on both sides (see above) and autoscales the axis with the new axis range.
- Y-Scroll down
- Scrolls the y-axis down by one delta step.
- Y-Scroll up
- Scrolls the y-axis up by one delta step.
- X-Scroll left
- Scrolls the x-axis by one delta step to the left.
- X-Scroll right
- Scrolls the x-axis by one delta step to the right.
- One Cycle left
- Scrolls the x-axis by the axis range or one period to the left.
- One Cycle right
- Scrolls the x-axis by the axis range or one period to the right.
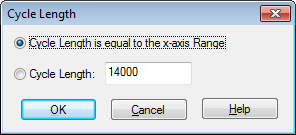
Set Cycle Length
- Zoom In
- Drag a rectangle around the section of the diagram. The diagram must be selected.
- Zoom Out (Autoscaling)
- Rescales the diagram so that all data is inside the axes range.
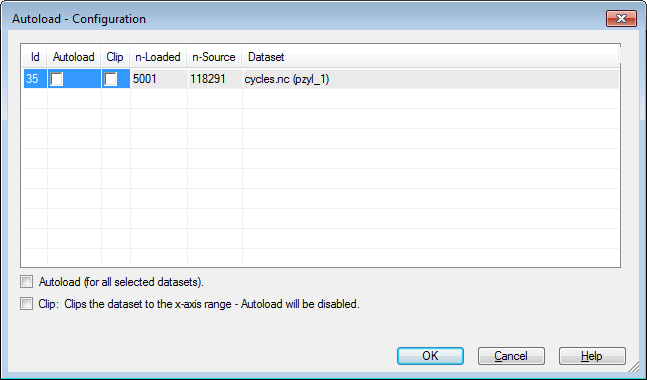
- Reload Data
- Clip: The x/y-datasets will be clipped at the x-axis range.
- Autoload: Will reload data for all datasets in the visible x-axis range, if the data is not already loaded.
Comment
Mouse Wheel Function: If a dataset is a diagram is selected, the mouse wheel can be used to scroll the x axis. If you press Shift while rotating it, the scroll speed it higher. If you hold down the Ctrl key, the x axis range can be changed. To change the y-axis range hold down the Alt key.
See also
id-1540857