Diagram=>X/Y/Z-Axis=>Parameters
Edits the value ranges and scale type of the axis in a selected diagram.
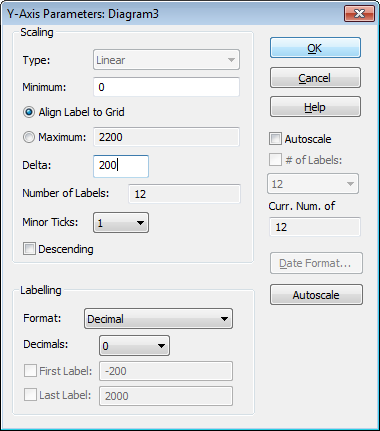
- Type
Sets the scaling type. The following scaling types are available:
- Linear
- Logarithmic
- Square
- Date/Time
- Log: Label linear. Logarithmic-scaled axis with linear labeling.
Example: 1 to 12 in steps of 2. The value of delta will be subtracted from the maximum value. The result would be the labels 1, 2, 4, 6, 8, 10 and 12.
Note: Only a linear scale can be plotted in a 3D diagram.
- Minimum, Maximum
Sets the range of each axis for the diagram.
For stacked diagrams (diagram with four yellow handles) the Maximum value for the y-Axis cannot be specified, if the option Align Label to Grid is selected. The Maximum value is derived from the axis length and the number of grid lines.
To change the grid of a stacked diagram select the x-axis and thereafter click on the
Ybutton in the toolbar and set Minimum, Maximum and Delta. See Stacked diagrams with multiple y axes.
Align Label to Grid
Can only be selected for the y-Axis of a stacked diagram.
For stacked diagrams the axes labels are aligned with the grid if this option is selected. In this case the Maximum value cannot be set. It will be calculated from the Minimum value, Delta, axis length and the number of grid lines.
See also Stacked diagrams with multiple y axes.
- Delta
Specifies the distance between the axis labels. Each label consists of a tick mark and the value of its position.
If an assigned dataset does not appear on the diagram, it probably lies outside of plot range. You can use the Autoscaling command to rescale the axis to fit the plot range to the assigned datasets.
To plot only a part of a dataset, reduce the plot range of the axes (Minimum and Maximum parameters) accordingly.
- Minor Ticks
- This function sets the number of tick marks to appear between the axis labels.
- Descending
- The scale of the axes can be reversed using this function.
- Label Format
- This functions allows you to choose between a decimal, exponential and hexadecimal format for the axis labels.
- Decimal Places
- Sets the number of decimal places for the number values of the axes. For the hexadecimal format the controls defines the numer of digits with leading zeros.
- First Label, Last Label
- Sets the value of the first and last labels. These values must lie between the minimum and maximum values you have already chosen.
- Autoscaling
- Allows you to rescale the range of the axes. This function adjusts the necessary ranges of the axis, to ensure that all datasets in the file can be fully plotted. In the 3D Plot, the 3D dataset will not automatically be clipped at the x- and y-axes. To plot the dataset correctly, use the Data=>Interpolation function after changes to the Min and Max parameters of the x- and y-axes have been made.
- Minimum fixed
- When Autoscaling is enabled for the axis, the minimum value can be fixed with this option. When the axis is autoscaled, the minimum value is not changed. For example, you can use it to define a percent axis that always starts at 0.
Comment
The scale type Log: Label linear has been introduced in UniPlot 4.2.2. Older UniPlot versions cannot display this scale type correctly.
History
| Version | Description |
|---|---|
| R2014.0 | Hexadecimal format added. |
| R2012.3 | New Option Align Label to Grid. |
id-1020774