Data=>3D-Dataset=>Z-Values
Use this dialog box to specify isoline values, fill colors and line styles.
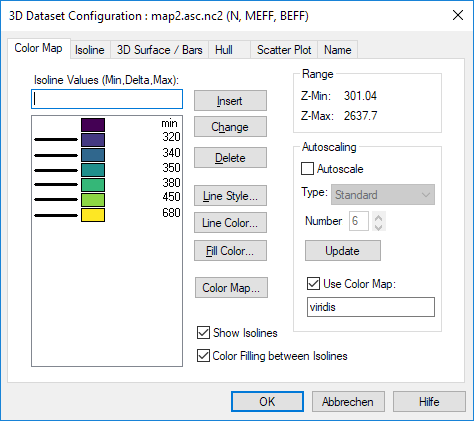
- Range
- Displays the smallest and largest z-value from the original data. This information is useful when it comes to choosing isoline values.
- Isoline Values
- The list box displays isoline values, line style and fill colors. The values are listed in ascending order. The first line always displays the isoline value min. The min isoline value is necessary to define a color fill for the smallest data area.
- Insert
There are two methods to insert values to this field:
- Enter a single number or
- Enter a range of values in the form Minimum, Delta, Maximum and then click the Insert button.
Example: The input of 100,10,130 generates the isoline values 100, 110, 120 and 130.
New values will be automatically inserted in the correct position. Only isoline values that are not already in the list will be transfered to it from the edit field.
A maximum of 99 different values can be entered.
- Change
- One of the selected isoline values in the list will be copied into the edit field. Edit the value and then click the Change button. The new value will be added to the list box and the old one will be deleted from the list.
- Delete
- To delete isoline values from the list, select the unwanted values with the mouse and then click the Delete button.
- Line Style
- To specify the line style for one or more isolines, select the isoline values in the list box and then click the Line Style button.
- Fill Color
- To specify the fill colors for one or more isolines, select the isoline values in the list box and then click the Fill Color button.
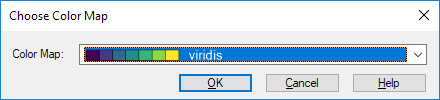
- Color Map
Opens a dialog box to choose a colormap. The colormap will be used to set the colors for all isolines. The check box of Use Color Map will be enabled if a color map is selected and the color map name will be displayed.
- Use Color Map
- If checked, the color map will be used to update the colors if the isoline values are modified. The first color will be assiged to the first value and the last color to the last value. If Autoscale is enabled, the color map will. If you have specified a number of iso-values, Autoscale is disabled and Use Color Map is disabled the colors will not be modified.
- Reverse Color Map
- If checked, the color map will reversed.
- Autoscale
- Isoline values can be generated with this function. The values displayed in the list will be deleted and the number of new values that were set in the Number box will be inserted into the list. The values will be chosen to enable the isolines to be distributed as regularly as possible onto the entire plot.
- Autoscale-Type
To select an autoscale type check the box Autoscale.
Standard: This type creates a number of isolines which are evenly distributed in the x/y plane.
Steps 1,2,5: This type creates isoline values in steps of 1, 2 or 5 or multiples of this value (10,20,50 or 100, 200, 500 etc).
Linear: This type calcultes a
delta = (zmax - zmin) / nValuesand rounds the result to one significant digit. The result is used to calculte the values.
History
| Version | Description |
|---|---|
| R2015.5 | Color Map and linear autoscale added. |
See also
Dialog Box=>Symbol Style, Dialog Box=>Font, Data=>3D-Dataset=>Isolines, Data=>3D-Dataset=>3D-Surface, Data=>3D-Dataset=>Hull
id-1394875