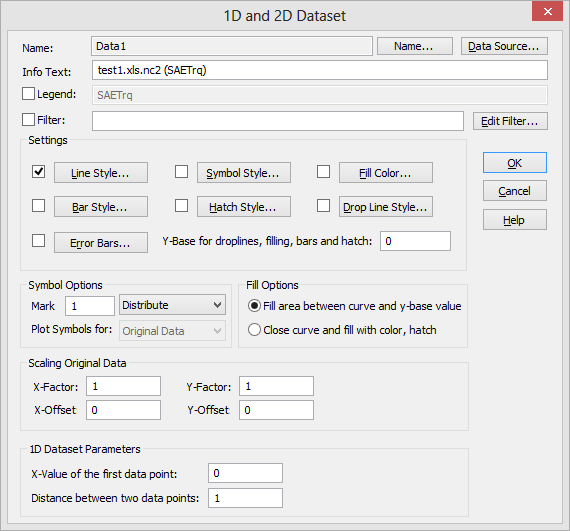
Data=>1D and 2D Dataset
Sets the plot parameter of a 1D/2D curve.
You can open this dialog box by a double-click on a 1D/2D curve.
- Dataset
- Shows the name of the selected dataset. All settings made in this box are related to this dataset.
- Name
- Name of the dataset. The name is unique in a document page. The name can be used to access the dataset in a automation script, see PageGetDatasetHandle. To edit the name click on the Name button.
- Infotext
- This text is displayed in the status bar when a dataset is selected. If the legend text is empty this text will be displayed in a legend.
- Legend
This text will be used in the field function
@f{legend}for the legend text (see Field Functions).If the legend text starts with an exclamation mark “!” the dataset will not be displayed in the legend.
If the check box is checked, the dataset legend text can be edited and will be protected against any modification. If the option Always update legend text of 1D and 2D datasets. in the dialog box File=>Import Options is disabled the legend text will never be updated.
- Filter
The orignal data can be used as an input for a list of filter functions. The original data is the data that has been used to create the data set. The filter functions are used to calculate the filtered data. For example the filter function could calculate a spline or sort the data.
If the check box is clicked and a valid filter function is specified, the filtered data will be displayed in the dataset.
Different filter functions are available: smooth data, calculate a spline, fit data etc. For a list of filter functions see Filter Functions for XY datasets.
The filter functions and their parameters can be edited directly or using the Edit Filter button. This button will open the dialog box Data=>Data Filter. The filter can consits of more than one filter function.
- Line Style
- If this box is selected, data points will be connected by a line. Line Style (type, color, width) can be set using the Dialog Box=>Line Style button.
- Bar Style
- If this box is selected, data points will be displayed as bars. See Dialog Box=>Bar Style.
- Dropline Style
- When this box is checked, vertical lines are dropped from each data point to the y-Base value. Drop lines run parallel to the y-axis. The line style of the drop line (type, color, width) can be set with the Dialog Box=>Line Style button.
- Error Bars
- Error bars can be displayed for x and or y coordinates. To set the error bar attributes open the dialog box Dialog Box=>Errorbars.
- Symbol Style
- If this box is chosen, the data points will be plotted as symbols. Symbol style (type, color, width) can be set by clicking the Dialog Box=>Symbol Style button.
- Hatch Style
- A curve can be hatched. See Dialog Box=>Hatch Style.
- Fill Color
- If this box is checked, the area between the curve and y-base value or the area in the closed curve polygon will be color filled. You can choose which area is to be filled in the Fill Choice option group. The color can be set by clicking the Fill Color button.
- y-Base for Droplines, Filling, Bars and Hatch
- The value should be specified in diagram coordinates.
- Fill Area Between Curve and y-Base Value
- If this option is chosen, the area between the curve and the y-base value will be color filled.
- Close Curve and Fill with Color, Hatch
- If this option is chosen, the last data point will be connected to the first data point with a line and the area within will be color filled.
- Symbol Options
- Specifies the the number of symbols to plot. The number can be a frequence or the number of symbols to distribute of the the visible data range.
- Plot Symbols for
- You can specify, if you want to plot filtered data or original data.
- Scaling Original Data
- The original data can be scaled separately in the x-and y-direction, (see XYSetScaleOffset).
- 1D Dataset Parameters
- Specifies the x-coordinate of the first data point and the distance of two data points in world coordinates.
See also
Data=>Data Filter, Filter Functions for XY datasets, Dialog Box=>Bar Style, Dialog Box=>Hatch Style, Dialog Box=>Symbol Style, Dialog Box=>Line Style, Data=>1D and 2D Dataset Properties
id-6161