1. Overview Diagrams
| Create and Destroy | |
|---|---|
| LayerCreate | LayerCreate creates a new diagram. |
| LayerDestroy | LayerDestroy destroys the given layer and frees any memory the layer occupied. |
| Get | |
|---|---|
| LayerCanHaveData | LayerCanHaveData checks if a layer can hold datasets. |
| LayerGetAllDatasets | LayerGetAllDatasets returns the handles of all datasets. |
| LayerGetAllObjects | LayerGetAllObjects returns the handles of all drawing objects. |
| LayerGetAutoScale | The LayerGetAutoScale returns TRUE (1) if an axis is automatically rescaled if the data of one of the datasets has been changed. |
| LayerGetAxisDateFormat | LayerGetAxisDateFormat returns the axis date format. |
| LayerGetAxisLink | LayerGetAxisLink returns a vector with handles of linked diagrams. |
| LayerGetAxisMinMaxDelta | LayerGetAxisMinMaxDelta returns the start, end and delta values of the axis scale. |
| LayerGetAxisPen | LayerGetAxisPen returns a copy of the axis pen. |
| LayerGetAxisPosition | LayerGetAxisPosition returns the position of the axis. |
| LayerGetAxisRelPosition | LayerGetAxisRelPosition returns the offset by which the axis will be moved relatively to its standard position. |
| LayerGetAxisScale | LayerGetAxisScale returns the scale type of the specified axis. |
| LayerGetBoundingBox | LayerGetBoundingBox returns the bounding box of a diagram. The bounding box is a rectangle that encloses all diagram elements and drawing objects. |
| LayerGetClip | LayerGetClip return the clipping flag. The flag gives an information on which side of the diagram the datasets are clipped. |
| LayerGetDiagramType | LayerGetDiagramType returns the diagram type. |
| LayerGetLink | LayerGetLink gets the link to the grid of a stacked diagram. |
| LayerGetMinMaxLinePen | LayerGetMinMaxLinePen returns the handle to a pen that is used to draw the min/max border lines. |
| LayerGetParentPage | LayerGetParentPage returns the handle of parent page. |
| LayerGetProps | LayerGetProps gets the font properties. |
| LayerGetSelectedDataset | LayerGetSelectedDataset returns the dataset handle that was last selected. |
| LayerGetSelectedDatasets | LayerGetSelectedDatasets returns the handles of all selected datasets. |
| LayerGetSelectedObjects | LayerGetSelectedObjects returns the handles of all selected drawing objects. |
| LayerIsAxisDescending | LayerIsAxisDescending |
| LayerIsMaxLine | LayerIsMaxLine checks if the maximum grid line is visible. |
| LayerIsMinLine | LayerIsMinLine checks if the minimum grid line is visible. |
| OBJGetVisible | OBJGetVisible determines whether a diagram (layer) or drawing object is visible. |
| Set | |
|---|---|
| LayerAddDataset | LayerAddDataset adds datasets to the given diagram. |
| LayerAddObjects | LayerAddObjects adds drawing objects to the given diagram. |
| LayerAutoScale | LayerAutoScale scales the diagram axes depending on the the data range of the diagram’s datasets. |
| LayerCMtoWC | LayerCMtoWC converts centimeter coordinates to world coordinates. |
| LayerCreateMetaFromFile | LayerCreateMetaFromFile creates an OLE drawing object from a file that was created using the OLESaveToFile function. The object will be added to the layer. |
| LayerGetAxisLinkName | LayerGetAxisLinkName returns the axis link name or an empty string if the axis is not linked. |
| LayerMoveDataset | LayerMoveDataset moves datasets to the specified diagram. Datasets can only be moved inside a page. The function can also be used to change the drawing order of datasets. |
| LayerMoveObjects | LayerMoveObjects moves Objects to the specified diagram. Objects can only be moved inside a page. The function can also be used to change the drawing order of Objects. |
| LayerSetAutoScale | The LayerSetAutoScale function specifies if an axis is automatically rescaled if the data of one of the datasets has been changed. |
| LayerSetAxisDateFormat | LayerSetAxisDateFormat sets the date/time format for the axis label. |
| LayerSetAxisDescending | The LayerSetAxisDescending function specifies the orientation of the axis scale. |
| LayerSetAxisLink | LayerSetAxisLink sets with which other diagram the x- or y-axis should be linked to. |
| LayerSetAxisLinkName | LayerSetAxisLinkName sets an diagram axis link. |
| LayerSetAxisMinMaxDelta | The LayerSetAxisMinMaxDelta function specifies the start and end values and the distance between two labels of the axis scale. |
| LayerSetAxisPen | LayerSetAxisPen sets the axis pen. |
| LayerSetAxisPosition | LayerSetAxisPosition specifies the position of the axis or hides the axis of an X/Y diagram. |
| LayerSetAxisRelPosition | The LayerSetAxisRelPosition function specifies the offset by which the axis will be moved relatively to its standard position. |
| LayerSetAxisScale | LayerSetAxisScale specifies the scale type of a diagram axis. |
| LayerSetClip | LayerSetClip sets if datasets are clipped at the diagram borders. |
| LayerSetDiagramType | LayerSetDiagramType sets the diagram type. |
| LayerSetLink | LayerSetLink sets the link to the grid of a stacked diagram or unlinks a diagram from a stacked diagram. |
| LayerSetMinMaxLinePen | LayerSetMinMaxLinePen |
| LayerSetProps | LayerSetProps sets the layer (diagram) properties. |
| LayerShowMinMaxLine | LayerShowMinMaxLine specifies if the diagrams min and max lines are visible. |
| LayerUpdateDocumentMap | LayerUpdateDocumentMap updates the document table that is used for the axes links. |
| LayerWCtoCM | LayerWCtoCM returns centimeter coordinates for the given world coordinates. |
| OBJSetVisible | OBJSetVisible shows or hides a diagram or drawing object. |
| Waterfall | |
|---|---|
| LayerGetWaterfallAttrib | LayerGetWaterfallAttrib returns waterfall attributes. |
| LayerGetWaterfallLabelFreq | LayerGetWaterfallLabelFreq returns a number that specifies how many datasets in a waterfall diagram should be labeled. |
| LayerGetWaterfallLabelType | LayerGetWaterfallLabelType returns the label type. The label type specifies how the datasets in waterfall diagram should be labeled. |
| LayerGetWaterfallOffset | LayerGetWaterfallOffset returns the width and height of a waterfall diagram. |
| LayerSetWaterfallAttrib | LayerSetWaterfallAttrib sets waterfall attributes. |
| LayerSetWaterfallLabelFreq | LayerSetWaterfallLabelFreq specifies how many datasets in a waterfall diagram should be labeled. |
| LayerSetWaterfallLabelType | LayerSetWaterfallLabelType specifies how the datasets in a waterfall diagram should be labeled. |
| LayerSetWaterfallOffset | LayerSetWaterfallOffset sets the width and height of a waterfall diagram. |
| 3D | |
|---|---|
| LayerGet3DBoxRatio | LayerGet3DBoxRatio gets the length of the 3D diagram edges. |
| LayerGet3DView | LayerGet3DView gets the view parameters of the 3D diagram. |
| LayerGet3DViewType | LayerGet3DViewType returns the 3D view type. The type can be orthographic or perspective. |
| LayerIs3D | LayerIs3D checks if the diagram is plotted as a 3D diagram. |
| LayerIs3DAxisLabelAlignHorz | LayerIs3DAxisLabelAlignHorz checks if the axis labels are aligned horizontally. |
| LayerIs3DBox | LayerIs3DBox checks, if the 3D diagram is plotted as a closed box. |
| LayerSet3D | LayerSet3D |
| LayerSet3DAxisLabelAlignHorz | LayerSet3DAxisLabelAlignHorz |
| LayerSet3DBoxRatio | LayerSet3DBoxRatio |
| LayerSet3DShowBox | LayerSet3DShowBox |
| LayerSet3DView | LayerSet3DView |
| LayerSet3DViewType | LayerSet3DViewType sets the projection type for a 3D diagram. |
| Polar | |
|---|---|
| LayerGetPolarConfig | LayerGetPolarConfig returns the polar diagram configuration. |
| LayerSetPolarConfig | LayerSetPolarConfig set the polar diagram configuration. |
| Titel | |
|---|---|
| LayerGetAxisTB | LayerGetAxisTB returns a copy of the handle of an axis title. |
| LayerGetAxisTextPosSize | LayerGetAxisTextPosSize returns the position and size of the bounding rectangle of an axis text. |
| LayerGetAxisTitle | LayerGetAxisTitle returns the axis title. |
| LayerGetAxisTitleFont | LayerGetAxisTitleFont returns the font of the specified axis. |
| LayerGetAxisTitleOffset | LayerGetAxisTitleOffset |
| LayerIsAxisTitle | LayerIsAxisTitle checks if the axis title is visible. |
| LayerIsAxisTitleAutoPos | LayerIsAxisTitleAutoPos returns if the position of the axis title is calculated automatically. |
| LayerIsAxisTitleFreePos | LayerIsAxisTitleFreePos returns TRUE (1) if the axis title position can be modified using the mouse. |
| LayerSetAxisTB | LayerSetAxisTB copies the specified text object into the axis title. |
| LayerSetAxisTitle | The LayerSetAxisTitle function specifies the axis title. |
| LayerSetAxisTitleAutoPos | LayerSetAxisTitleAutoPos specifies if the position of the axis title should be calculated automatically. |
| LayerSetAxisTitleFont | LayerSetAxisTitleFont sets the axis title font. |
| LayerSetAxisTitleFreePos | LayerSetAxisTitleFreePos specifies if the position of the axis title can be modified using the mouse. |
| LayerSetAxisTitleOffset | LayerSetAxisTitleOffset specifies the position of the axis title relative to the axis. |
| LayerShowAxisTitle | LayerShowAxisTitle shows or hides axis title. |
| Label | |
|---|---|
| LayerGetAxesAttribs | The LayerGetAxesAttribs retrieves display attribs for the diagram axis. |
| LayerGetAxisLabel | LayerGetAxisLabel returns the axis labels as a string vector. |
| LayerGetAxisLabelFont | LayerGetAxisLabelFont returns the handle of the axis label font. |
| LayerGetAxisLabelFormat | LayerGetAxisLabelFormat returns the number format of the axes labels. |
| LayerGetAxisUserLabel | LayerGetAxisUserLabel retrieves the user labels. The user labels are labels which can be places at the axis. The labels can display text. |
| LayerGetAxisUserLabelAttribs | LayerGetAxisUserLabelAttribs returns the display attributes for axis labels. |
| LayerGetFirstLabel | LayerGetFirstLabel returns the value set with LayerSetFirstLabel. No labels are displayed below this value. |
| LayerGetLabelNum | Gets the number of axis labels for autoscale set with:ref:LayerSetLabelNum. |
| LayerGetLastLabel | LayerGetLastLabel returns a value set with LayerSetLastLabel. No labels are displayed above this value. |
| LayerGetWaterfallLabelFreq | LayerGetWaterfallLabelFreq returns a number that specifies how many datasets in a waterfall diagram should be labeled. |
| LayerGetWaterfallLabelType | LayerGetWaterfallLabelType returns the label type. The label type specifies how the datasets in waterfall diagram should be labeled. |
| LayerIs3DAxisLabelAlignHorz | LayerIs3DAxisLabelAlignHorz checks if the axis labels are aligned horizontally. |
| LayerIsAxisLabel | LayerIsAxisLabel checks if the axis labels are visible. |
| LayerIsFirstLabel | LayerIsFirstLabel |
| LayerIsLabelNumEnabled | Returns TRUE if the fixed number of labels is used for autoscale. |
| LayerIsLastLabel | LayerIsLastLabel |
| LayerSet3DAxisLabelAlignHorz | LayerSet3DAxisLabelAlignHorz |
| LayerSetAxesAttribs | The LayerSetAxesAttribs sets display attribs for the x an y axis. |
| LayerSetAxisLabel | LayerSetAxisLabel specifies the text of the axis labels. |
| LayerSetAxisLabelFont | LayerSetAxisLabelFont sets the axis label font. |
| LayerSetAxisLabelFormat | LayerSetAxisLabelFormat specifies the number format of the axis labels. |
| LayerSetAxisUserLabel | LayerSetAxisUserLabel sets the user labels. The user labels are labels which can be places at the axis. The labels can display text. |
| LayerSetAxisUserLabelAttribs | LayerSetAxisUserLabelAttribs sets display attributes for axis labels. |
| LayerSetFirstLabel | LayerSetFirstLabel |
| LayerSetFixedLabelNum | Sets in connection with LayerSetLabelNum the number of axis labels for autoscale. |
| LayerSetLabelNum | Sets in connection with LayerSetFixedLabelNum the number of axis labels for autoscale. |
| LayerSetLastLabel | LayerSetLastLabel sets a value for the specified axis. No labels are displayed above this value. |
| LayerSetWaterfallLabelFreq | LayerSetWaterfallLabelFreq specifies how many datasets in a waterfall diagram should be labeled. |
| LayerSetWaterfallLabelType | LayerSetWaterfallLabelType specifies how the datasets in a waterfall diagram should be labeled. |
| LayerShowAxisLabel | LayerShowAxisLabel shows or hides axis lables. |
| LayerShowFirstLabel | LayerShowFirstLabel |
| LayerShowLastLabel | LayerShowLastLabel |
| Grid | |
|---|---|
| LayerGetMajorGridPen | LayerGetMajorGridPen returns the handle to a pen that is used to draw the major grid lines. |
| LayerGetMinorGridPen | LayerGetMinorGridPen returns the handle to a pen that is used to draw the minor grid lines. |
| LayerIsMajorGrid | LayerIsMajorGrid checks if the major grid lines are visible. |
| LayerIsMinorGrid | LayerIsMinorGrid checks if the minor grid lines are visible. |
| LayerSetGridPen | LayerSetGridPen sets the grid line pen. |
| LayerShowGrid | LayerShowGrid specifies, if the diagram grid will be visible. |
| Cursor Functions | |
|---|---|
| LayerAddCursorColumnNames | LayerAddCursorColumnNames |
| LayerGetCursorAttrib | LayerGetCursorAttrib returns attributes about the cursor. |
| LayerGetCursorPen | LayerGetCursorPen |
| LayerGetCursorPosition | LayerGetCursorPosition returns the cursor position. |
| LayerIsCursor | LayerIsCursor |
| LayerSetCursorAttrib | LayerSetCursorAttrib sets the cursor attributes. |
| LayerSetCursorColumnData | LayerSetCursorColumnData |
| LayerSetCursorPen | LayerSetCursorPen |
| LayerSetCursorPosition | LayerSetCursorPosition |
| LayerShowCursor | LayerShowCursor enables or disables the data cursor. |
More settings can be set here: Overview Drawing Objects.
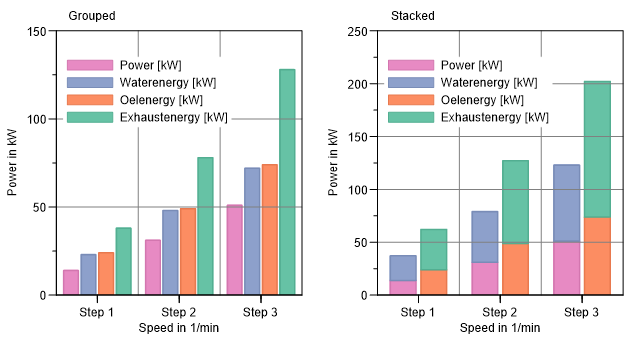
1.1. Stacked/Grouped Bab Plots (Category Plot)
A category plot has an x-axis for the categories and a y-axis for the numeric values. Each category can display a value or text. Most often the data is displayed as bars. The width and position of the bars is set automatically. The bars in a category (group) can be stacked and/or displayed side-by-side. Each bar can display ity y-value.
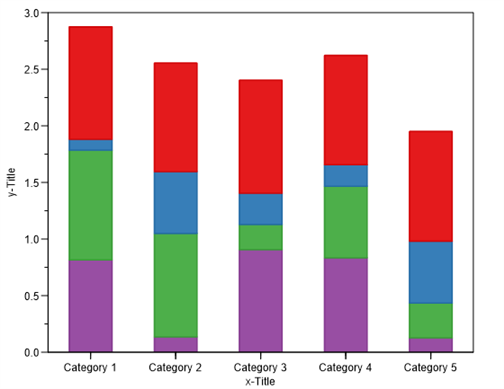
Only the x axis can be used as a category axis. The category axis starts with 0 and ends at the number of categories +1. The axis can be set as a category axis in the Diagram=>X/Y/Z-Axis=>Parameters dialog box.
The bars can only displayed vertical. All bars will have the identical width. Between the bars and the categories a gap size can be specified.
For a category plot the x coordinates of datasets are ignored. The first data point will be added the the first category. Only the first 1025 data points will be displayed in a category plot.
- To create a category plot choose
Type = "Category Plot"in the data browser. - For the “Label” field choose a channel to label the x-axis. This can be a real or string channel.
- Drag all channels into a diagram or onto a document page.
The functions NC_plotcategory and plotcategory can be used to create a category with UniScript. With NC_plotcategory a category plot can be created directly from an NC file. If the is already calculated plotcategory can be invoked.
| Kategorie-Plots | |
|---|---|
| LayerGetCategoryGapWidth | LayerGetCategoryGapWidth gets the gap between the the categorys of a category plot. |
| LayerGetCategoryOverlap | LayerGetCategoryOverlap gets the gap between the the categorys of a category plot. |
| LayerSetCategoryGapWidth | LayerSetCategoryGapWidth sets the gap size between categories of a category plot. |
| LayerSetCategoryOverlap | LayerSetCategoryOverlap sets the overlap between the datasets (bars) of a category plot. |
id-1650015