nonlin
nonlin computes the parameters of a given (non linear) function so that the deviation of the function for the given data points is minimized.
-
pEnd = nonlin(fit, y, x, pStart) -
pEnd = nonlin(fit, y, x, pStart, bPrint)
Return Value
pEnd are the parameters of the function fit.
Parameters
-
fit fit is a function provided by the user (see example).
-
y y is a column vector with y-coordinates.
-
x x is a column vector with x-coordinates.
-
pStart pStart is an estimated start vector.
-
bPrint If bPrint is FALSE (0), no information is printed into the command window.
Example
def fit_exp(x, p)
{
    return p[1] + p[2] .* exp(p[3] .* x);
}
rmXY = [ ..
    1.2600,      0.4000;
    1.6000,      0.2800;
    1.6300,      0.2900;
    1.6500,      0.2300;
    1.6900,      0.2000;
    1.7000,      0.1850;
    1.7600,      0.1600;
    2.0000,      0.0750;
    2.2300,      0.0550;
    2.5000,      0.0400];
p_start = [0,0,0];
p_end = nonlin(fit_exp, rmXY[;2], rmXY[;1], p_start);
x = linspace(1.2, 2.6, 50);
y = fit_exp(x', p_end);
h = plot(x, y);
h = plot (rmXY[;1], rmXY[;2], h[2]);
XYShowMarker(h[3], TRUE);
XYShowLine(h[3], FALSE);
PageReplot(h[1]);
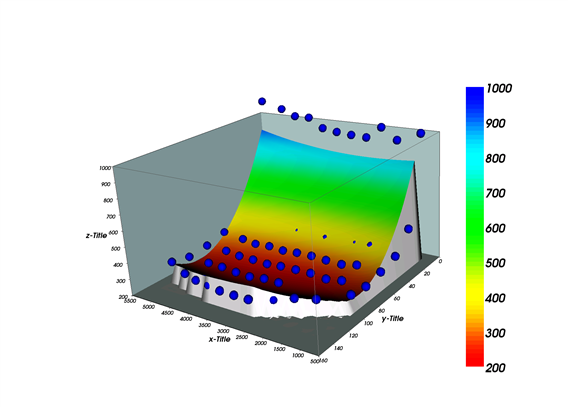
nonlin kann auch für xyz-Datensätze verwendet werden, hier ein Beispiel:
def fit_xyz_poly2(_x, p)
{
    x = _x[;1]
    y = _x[;2]
    return p[1] + ..
           p[2] .* x + ..
           p[3] .* y + ..
           p[4] .* x .* x + ..
           p[5] .* y .* y + ..
           p[6] .* x .* y;
}
def test2(hDataXYZ)
{
    rmXYZ = XYZGetData(hDataXYZ);
    p_start = zeros(1,6); [0.1, 1, 1, 1, 0.01, 1];
    p_end = nonlin(fit_xyz_poly2, rmXYZ[;3], rmXYZ[;1,2], p_start);
    Z = fit_xyz_poly2(rmXYZ[;1,2], p_end)
    plotmatrix(rmXYZ[;1], rmXYZ[;2], Z)
}
See also
id-697354