3D-Classification of a XY-Dataset
Introduction
The addin “3D-Classification of a XY dataset” computes a 2-dimensional histogram of two data channels. The two data channels are the x and y coordinates of a XY dataset (2D dataset).
Installation
Choose Tools=>Add-In Manager.
Select the Add-In “3D-Classification of a XY dataset”.
rs_class.ic UniScript File rs_class.icl rs_class.ic in übersetzter Form
Usage
Create a 2D dataset in a diagram.
Right click on the curve (or scatter plot) and choose New Dataset=>3D Classification (Compound Counting).
The following dialog box will be displayed:
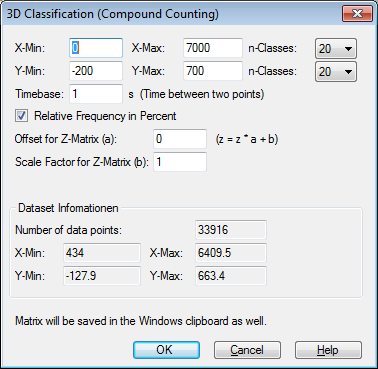
Specify the number of bins in x- and y-direction.
Choose OK. A new document with the histogram as a 3D bar plot or color matrix will be created.
Procedure
The function counts the data points in each bin. If the data was measured over time, the number of points gives you the dwell time in each bin. If the frequency was not 1 Hz, the sampling rate can be set to calculate the dwell time. The histogram matrix can be scaled using the offset and scale factor.
Range Counting Method
At first a threshold is specified for finding the peaks and troughs in a signal. Ranges smaller than the threshold will be ignored. If the threshold is set to 0 all ranges will be counted.
The ranges in x and y direction will be classified.
Updating data during data exchange
The classification is updated during data exchange. It is required that the dataset with the data to be classified still exists in the document. This means that the dataset must not be deleted. The diagram with the dataset can be hidden (double-click in the diagram to select the diagram options). The parameters of the classification can be modified by right-clicking on the Classification dataset.
History
- R2018.8: Data will be updated during data exchange.
- 14.06.2011: Documentation added.
id-1412275